
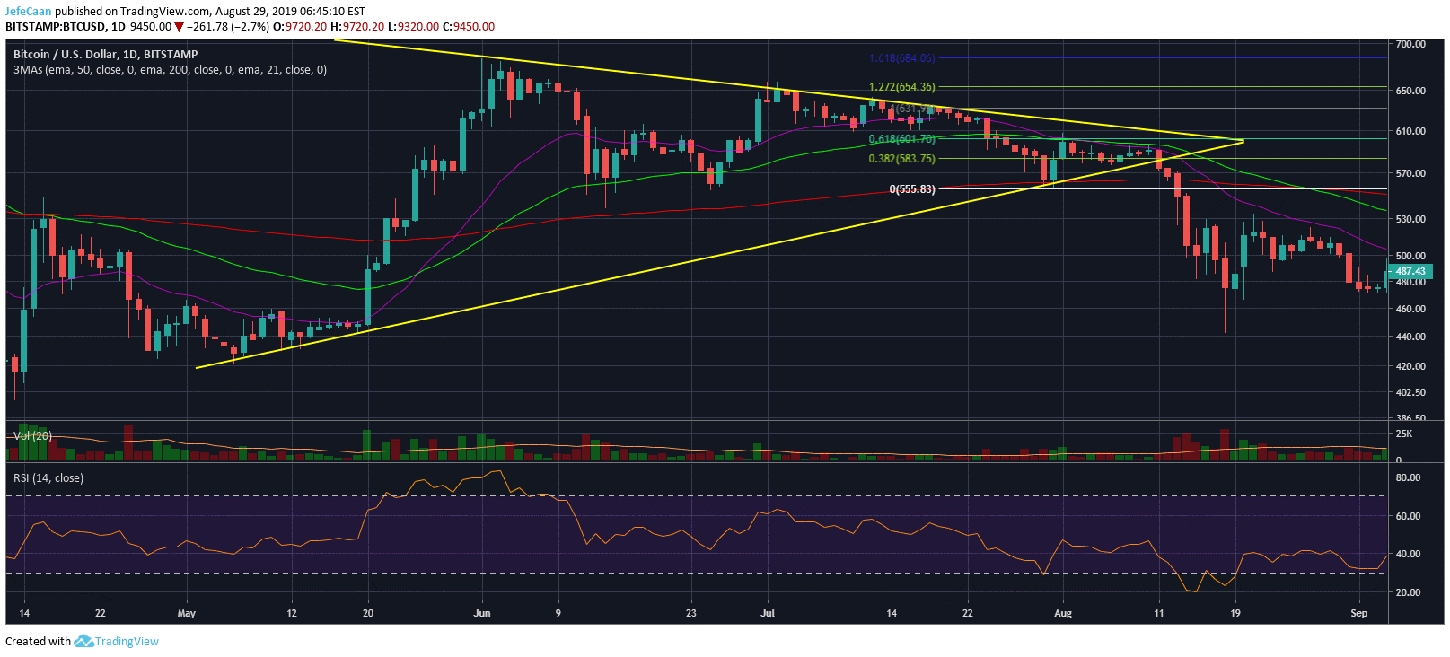
Bitcoin (BTC) is still very likely to rally past ,000 even under the bearish case. It may seem a little odd to say that after recent bearish developments but the fact that it seems odd is a reason in itself why it might happen. If we look at the daily chart for BTC/USD, we can see a symmetrical triangle that has yet to be broken despite the recent crash. So, the bulls have a pretty good reason to buy the dip here and expect the price to break out of the symmetrical triangle and rally towards a new yearly high. I remain bearish as I don’t think the bear market is over just yet and the current price action bears a strong resemblance to the 2014 part of the previous cycle.

However, not only do I not discount the possibility of a move past $11,000, I think it is very probable and we may not see the downtrend begin before that happens. The price crashed too far too fast and now the bulls are in a better position to save it from here. The moment we see a green candle to the upside on the daily time frame, everyone will start talking about a new yearly high again. This is how long it takes for sentiment to change in this market. All the big accounts on Crypto Twitter were overly bullish two days ago. Now, they want you to wait to catch the altcoin bottom. If you lack clarity and have a gambler’s approach to trading you will keep taking these 180 degree turns switching from bearish to bullish and vice versa. Everyone is expecting the price to crash from here and it is no surprise that the Longs vs. Shorts ratio for Bitcoin (BTC) has come down to 60-40 from 65-35 in favor of the bulls.
Let us take a look at a similar symmetrical triangle from the 2014 part of the previous cycle. We can see how this symmetrical triangle broke to the downside. However, before it did that, we saw a move to the upside that led to a retest of the 61.8% fib retracement level from the local top of the symmetrical triangle. The price closed below it and was eventually followed by further downside. However, if you look at the manner in which the candles consolidated, it led the bulls to believe that the price was going to break to the upside towards new yearly highs.
As we saw BTC/USD ended up declining below this symmetrical triangle and had to fall almost 80% from there till it bottomed. I expect the same to happen this time with the price finding its true bottom between $1,200 and $1,800 but before the downtrend begins, a lot of bears that are hoping for easy money are going to be shaken out. This might be bears that have tight stops to minimize risks or bears that are overly aggressive and have high leverage positions with nearby stops that the market makers would love to liquidate. So, the play here as always is to hunt down the bears and trap in the bulls to be slaughtered later.
Source link