
Bitcoin
Bitcoin (BTC/USD) edged lower early in today’s Asian session as the pair traded as low as the 10,842.01 area following steady selling pressure in yesterday’s European and North American sessions. Traders were unable to punch BTC/USD above the 11,978.03 area during yesterday’s Asian session, an important technical level that represents the 38.2% retracement of the move from 8919.72 to 13,868.44. The next upside retracement level related to this range is the 12,700.54 area and the next downside retracement level related to this range is the 11,394.08 level followed by the 10,810.13 area.
Traders lifted BTC/USD before it tested the 10,810.13 area early in the Asian session, and chartists are citing the 10,646.32 area as the next downside target. The 200-bar MA (4-hourly) is creeping higher and is currently indicating at 10,500.67. During yesterday’s North American session, selling pressure emerged around the 100-bar MA (4-hourly). Given the ongoing convergence of the 100-bar MA (4-hourly) and the 200-bar MA (4-hourly), technicians are looking to see if bullish sentiment or bearish sentiment will prevail. Chartists anticipate some Bids between the 10,080 – 10,230 range.
Price activity is nearest the 200-bar MA (4-hourly) at 10,580.34 and the 50-bar MA (Hourly) at 11,503.69.
Technical Support is expected around 10,234.22/ 10,087.62/ 9,948.12 with Stops expected below.
Technical Resistance is expected around 11,510.44/ 11,759.02/ 12,063.68 with Stops expected above.
On 4-Hourly chart, SlowK is Bearishly below SlowD while MACD is Bearishly below MACDAverage.
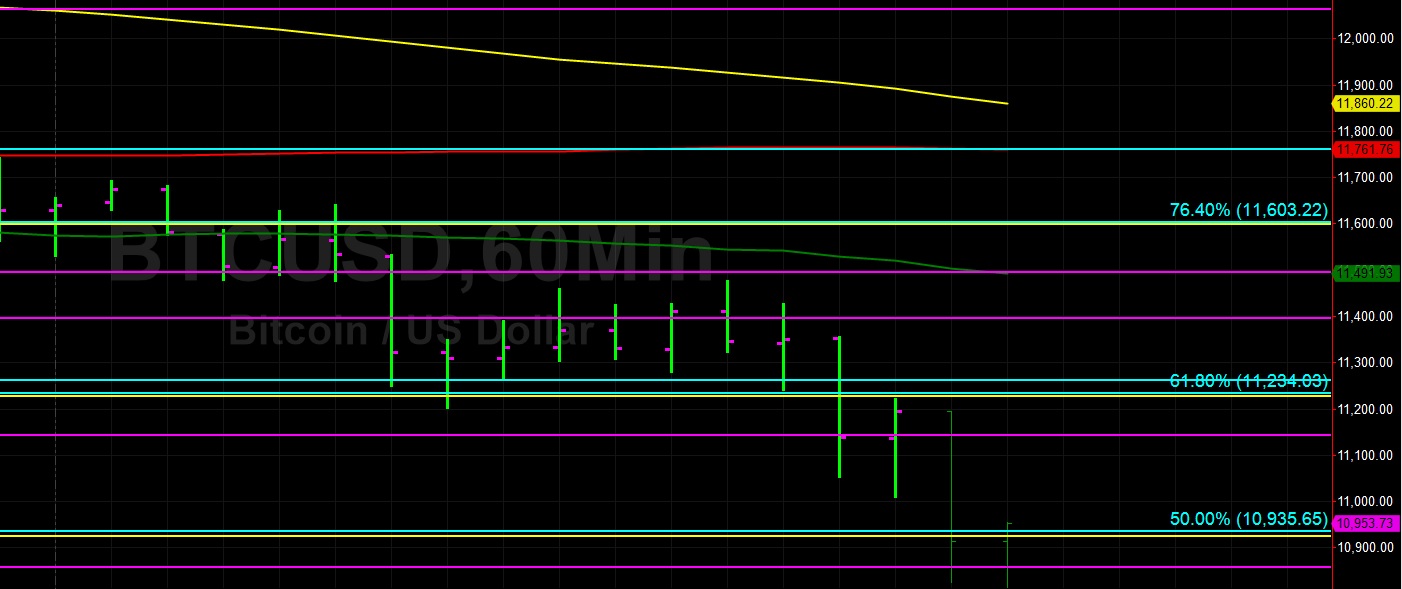
On 60-minute chart, SlowK is Bearishly below SlowD while MACD is Bearishly below MACDAverage.
Ethereum
Ethereum (ETH/USD) slumped early in today’s Asian session as the pair traded as low as the 262.61 area after selling pressure emerged during yesterday’s Asian session and consistently pressured the price lower during yesterday’s European and North American sessions. Traders were unable to push ETH/USD above the 279.25 level during the move higher one day ago, a level that represents the 61.8% retracement of the move from 144.15 to 364.49. The next downside price level related to this range is the 259.11 area.
Sentiment continues to remain bearish for ETH/USD, at least in the short-term. Price activity is quickly approaching some very important levels. The 260.89 area is an important level and the 258.92 area represents the 38.2% retracement of the move from 547.40 to 80.60. ETH/USD has tested the 258.92 level multiple times over the past month, and last traded below the level around 14 June. Sizable Stops are likely in place below this area, and if they are elected it could hasten the slide to the next downside targets including the 257.22 area and the 255.25 area. Additionally, the 249.90 and 246.88 areas are important downside targets.
Price activity is nearest the 200-bar MA (4-hourly) at 286.97 and the 50-bar MA (Hourly) at 271.50.
Technical Support is expected around 255.25/ 249.90/ 236.43 with Stops expected below.
Technical Resistance is expected around 291.51/ 298.24/ 306.99 with Stops expected above.
On 4-Hourly chart, SlowK is Bearishly below SlowD while MACD is Bearishly below MACDAverage.
On 60-minute chart, SlowK is Bearishly below SlowD while MACD is Bearishly below MACDAverage.
Source link