
Bitcoin
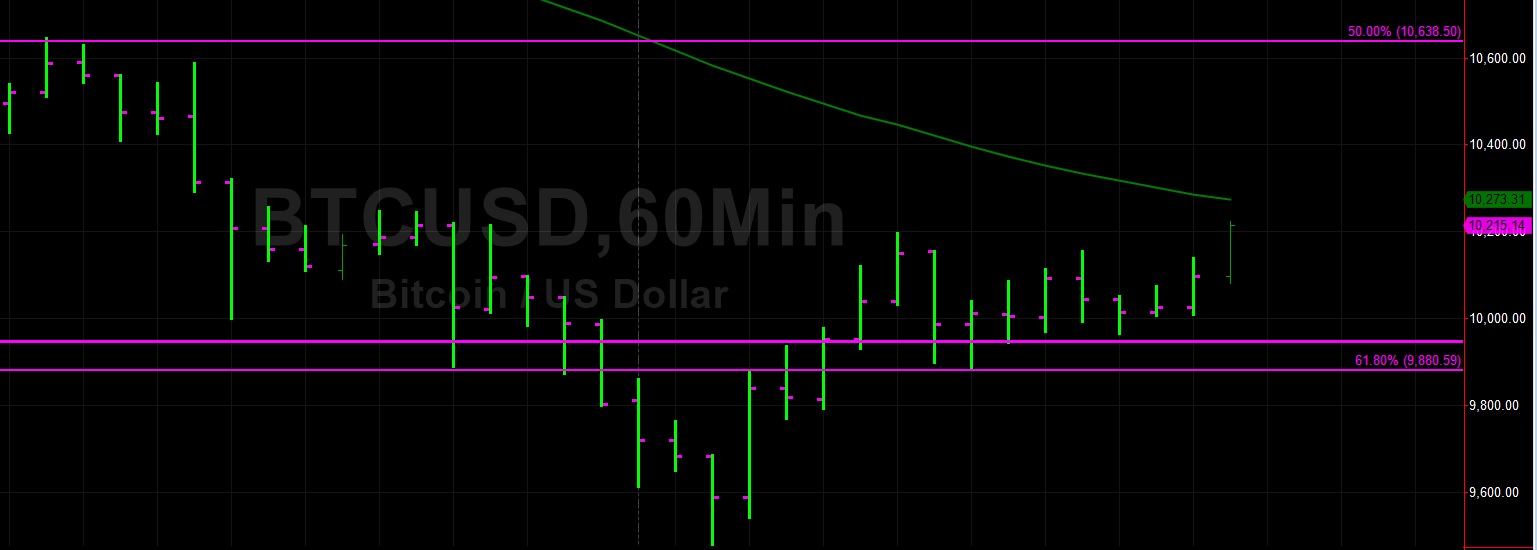
Bitcoin (BTC/USD) gained a little bit of ground early in today’s Asian session as the pair escalated higher to the 10,154.74 level following another sharp move lower overnight that saw the pair test the 9,470.00 level, its weakest print since late July. The pair was unable to get back above the 10,234.22 area during yesterday’s Asian session and European session, representing the 50% retracement of the move from 6,600 to 13,868.44. Bids emerged around the 9,470.23 level during today’s Asian session to reverse the quick decline lower, representing the 50% retracement of the move from 5,072.01 to 13,868.44.
The 50-bar MA (4-hourly) and 200-bar MA (4-hourly) are both above current market activity and both are now sloping downward while the 50-bar MA (hourly), 100-bar MA (hourly), and 200-bar MA (hourly) are also above current market activity and sloping downward. Market sentiment clearly has a downward bias now. Technicians are eyeing some downside price objectives including 9285, 9071, and 8,919. Also, some technical Support is expected around the 8,488 and 8,338 levels.
Price activity is nearest the 200-bar MA (4-hourly) at 10,550.27 and the 50-bar MA (Hourly) at 10,271.03.
Technical Support is expected around 9,765.93/ 9,265.49/ 8,919.72 with Stops expected below.
Technical Resistance is expected around 10,638.50/ 10,810.13/ 11,136.82 with Stops expected above.
On 4-Hourly chart, SlowK is Bullishly above SlowD while MACD is Bearishly below MACDAverage.
On 60-minute chart, SlowK is Bullishly above SlowD while MACD is Bullishly above MACDAverage.
Ethereum
Ethereum (ETH/USD) gained ground to the 188.03 level early in today’s Asian session following another significant downturn during yesterday’s Asian session that saw the pair test Bids around the 171.00 level after depreciating from the 190.00 figure. Notably, the 183.84 area was a downside price objective target related to the recent depreciation from the 318.60 level. Stops were reached below the 183.84 area earlier this week, and this resulted in yesterday’s move lower that saw Stops elected below the 172.88 area.
This level is technically significant because it represents the 38.2% retracement of the move from 322.16 to 80.60. Additional Stops were elected above this area and below the 175.06 area, another important retracement level that represents the 23.6% retracement of the move from 547.54 to 80.60. Another downside price objective that traders are focusing on is the 152.08 area, with the 142.22 level representing an important area below that level.
Price activity is nearest the 50-bar MA (4-hourly) at 213.09 and the 50-bar MA (Hourly) at 205.32.
Technical Support is expected around 181.84/ 165.25/ 157.28 with Stops expected below.
Technical Resistance is expected around 197.56/ 206.18/ 217.55 with Stops expected above.
On 4-Hourly chart, SlowK is Bearishly below SlowD while MACD is Bearishly below MACDAverage.
On 60-minute chart, SlowK is Bullishly above SlowD while MACD is Bearishly below MACDAverage.
Source link