
Bitcoin
Bitcoin (BTC/USD) continued to gain ground above the psychologically-important 10,000 figure early in today’s Asian session as traders continued to advance towards the 11,000 figure. Short-term bias has firmed in the favour of BTC/USD Bulls over the past several days ever since the pair bounced higher from the 9,470.23 level on 15 August, representing the 50% retracement of the move from 5,072.01 to 13,868.44. Bids then firmed up market sentiment around the 9,765, 9,938, 10,268, and 10,646 levels, leading to price appreciation.
Traders have been attempting to establish a foothold above the 50-bar MA (4-hourly) for several sessions, and traders are attempting to test the 100-bar MA (4-hourly). In order to advance higher, traders will need to establish some Bids above the 100-bar MA (4-hourly). Also, traders have been attempting to gain traction above the 200-bar MA (hourly), and it appears the 50-bar MA (hourly) and 200-bar MA (hourly) are converging. Upside price targets include the 11,032 and 11,175 levels.
Price activity is nearest the 100-bar MA (4-hourly) at 11,053.42 and the 200-bar MA (Hourly) at 10,575.83.
Technical Support is expected around 9,765.93/ 9,265.49/ 8,919.72 with Stops expected below.
Technical Resistance is expected around 11,136.82/ 11,333.91/ 11,510.44 with Stops expected above.
On 4-Hourly chart, SlowK is Bullishly above SlowD while MACD is Bullishly above MACDAverage.
On 60-minute chart, SlowK is Bullishly above SlowD while MACD is Bearishly below MACDAverage.
Ethereum
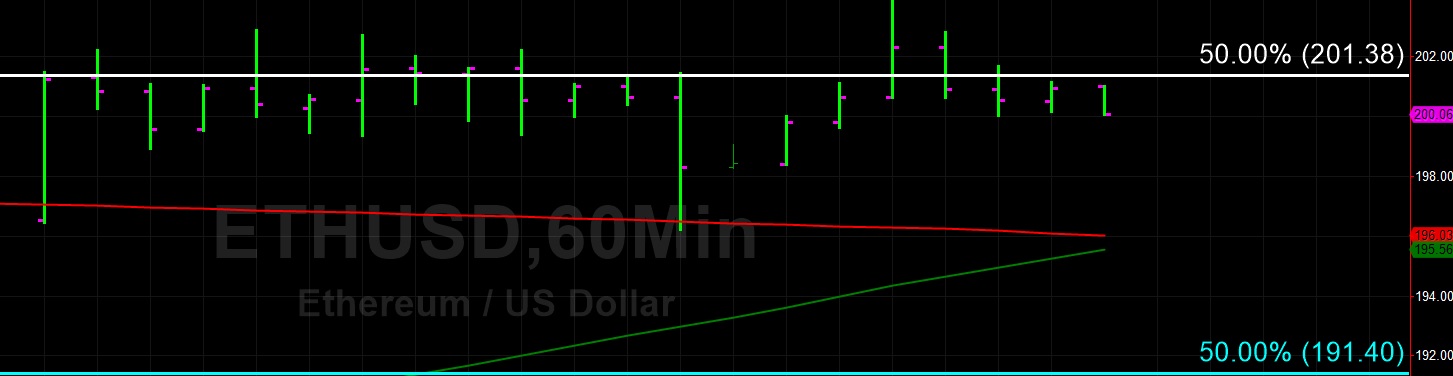
Ethereum (ETH/USD) orbited the psychologically-important 200.00 figure early in today’s Asian session, one day after traders absorbed that level for the first time since 14 August. Traders have been attempting to establish buying pressure above the 50-bar MA (4-hourly), with Bids having recently kept the pair supported around the 196.21 level. Technicians continue to assess market conviction, as the pair continues to trade between the 50-bar MA (4-hourly) and 100-bar MA (4-hourly).
Above those levels, the 200-bar MA (4-hourly) continues to represent technical Resistance. Chartists are looking to see if the pair can remain Bid above the 196.15 level, representing the 76.4% retracement of the move from 144.15 to 364.49. A very important level that chartists are watching is the 202.27 level, representing the 61.8% retracement of the move from 148.81 to 288.77. Another important area remains the 209.75 level, representing the 23.6% retracement of the 627.83 – 80.60 range.
Price activity is nearest the 50-bar MA (4-hourly) at 196.14 and the 200-bar MA (Hourly) at 196.03.
Technical Support is expected around 191.40/ 183.33/ 178.47 with Stops expected below.
Technical Resistance is expected around 206.18/ 209.75/ 217.55 with Stops expected above.
On 4-Hourly chart, SlowK is Bullishly above SlowD while MACD is Bullishly above MACDAverage.
On 60-minute chart, SlowK is Bullishly above SlowD while MACD is Bullishly above MACDAverage.
Source link