
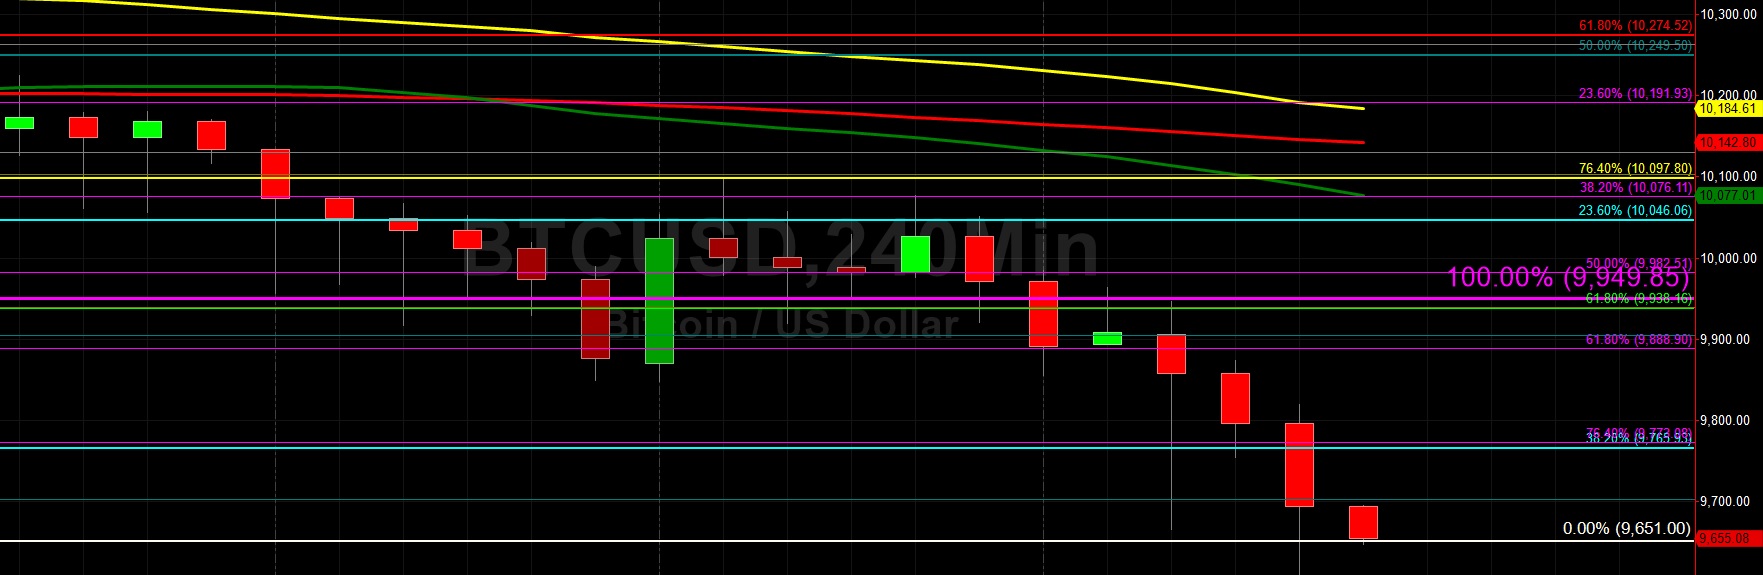
Bitcoin
Bitcoin (BTC/USD) extended its recent losses early in today’s Asian session as the pair traded as low as the 9609.37 area following a very volatile US trading session that saw Stops elected below the 9765.93 area, representing the 38.2% retracement of the 3128.89 – 13868.44 range. A clue about the pair’s short-term bearish direction emerged during yesterday’s North American session when traders lifted the pair to the 9938.16 area, only to meet Offers and intense selling pressure that knocked the pair lower towards its weakest level this month.
BTC/USD is now trading below its 50-bar MA (4-hourly), 100-bar MA (4-hourly), and 200-bar MA (4-hourly) and also continues to depreciate below its 50-bar MA (hourly), 100-bar MA (hourly), and 200-bar MA (hourly). Traders and chartists continue to focus on the 9532.39 area as an important downside price objective with additional selling pressure possible down to the 9285.48 area, representing the 50% retracement of the move from 4702.53 to 13868.44. Some Bids are expected between the 8929 – 9071 area.
Price activity is nearest the 50-bar MA (4-hourly) at 10,089.96 and the 50-bar MA (Hourly) at 9,928.76.
Technical Support is expected around 9,703.49/ 9,532.39/ 9,265.49 with Stops expected below.
Technical Resistance is expected around 10,557.58/ 10,833.14/ 10,939.34 with Stops expected above.
On 4-Hourly chart, SlowK is Bearishly below SlowD while MACD is Bearishly below MACDAverage.
On 60-minute chart, SlowK is Bearishly below SlowD while MACD is Bearishly below MACDAverage.
Ethereum
Ethereum (ETH/USD) fell sharply early in today’s Asian session as the pair traded as low as the 198.18 level following intense selling pressure that emerged around the 210.52 area late in yesterday’s North American session. The pair orbited the 209.75 area during yesterday’s Asian and European sessions before the significant selling pressure commenced, representing the 23.6% retracement of the move from 627.83 to 80.60. Some Stops were triggered when the pair fell below the 50-bar MA (4-hourly), currently indicating around the 208.45 area.
Some Bids emerged above the 197.56 area during the move lower, representing the 76.4% retracement of the move from 146.00 to 364.49. Below this areas, the 100-bar MA (4-hourly) is currently indicating around the 194.01 area and then the 191.40 area represents the 50% retracement of the 302.20 – 80.60 range. The 50-bar MA (hourly) and 200-bar MA (hourly) are currently converging and this appears to be a bearish development, with price activity now trading below the 200-bar MA (hourly).
Price activity is nearest the 100-bar MA (4-hourly) at 194.01 and the 200-bar MA (Hourly) at 208.30.
Technical Support is expected around 197.56/ 191.40/ 188.38 with Stops expected below.
Technical Resistance is expected around 213.84/ 217.55/ 226.56 with Stops expected above.
On 4-Hourly chart, SlowK is Bearishly below SlowD while MACD is Bearishly below MACDAverage.
On 60-minute chart, SlowK is Bearishly below SlowD while MACD is Bearishly below MACDAverage.
Source link