
Bitcoin
Bitcoin (BTC/USD) extended recent gains early in today’s Asian session as the pair climbed to the 10486.77 level in a show of strength that erased all of the losses incurred after the sharp depreciation from the 10277.00 figure last week. The pair tested a recent relative high from 23 August and then retreated lower. Stops were elected above the 10,083.05 area during the appreciation, representing the 100-bar MA (4-hourly). The break above the psychologically-important 10,000 figure now opens up additional upside price targets and objectives.
Stops were also triggered above the 200-bar MA (hourly) during the climb higher, then around the 9856.43 level, and then also above the 9948.12 area, a relative historic high that has served as both technical Support and technical Resistance in the past. Chartists are looking to see if the Bids can be established around or above the 9880.59 and 9948.12 levels in the near-term. Above current market activity, some important levels include the 10810, 10955, and 11262 areas.
Price activity is nearest the 200-bar MA (4-hourly) at 10561.56 and the 200-bar MA (Hourly) at 9,861.56.
Technical Support is expected around 9,765.93/ 9,532.39/ 9,265.49 with Stops expected below.
Technical Resistance is expected around 10,810.13/ 11,136.82/ 11,759.72 with Stops expected above.
On 4-Hourly chart, SlowK is Bearishly below SlowD while MACD is Bullishly above MACDAverage.
On 60-minute chart, SlowK is Bearishly below SlowD while MACD is Bullishly above MACDAverage.
Ethereum
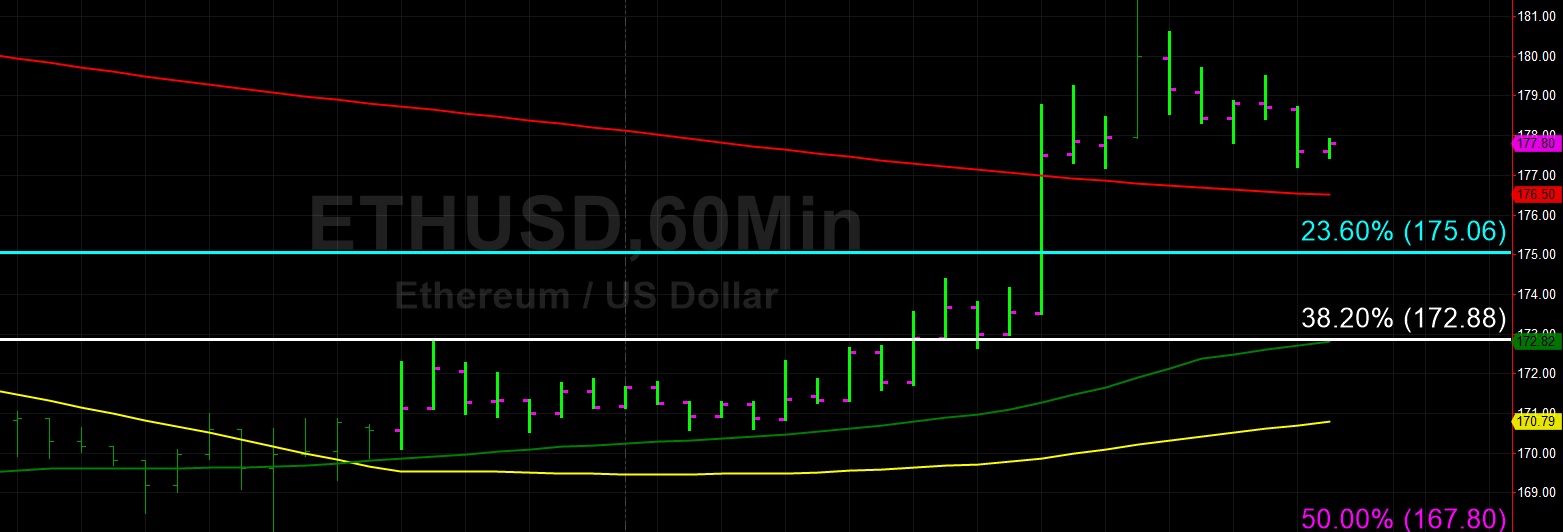
Ethereum (ETH/USD) weakened early in today’s Asian session but only after the pair traded as high as the 181.78 area late in yesterday’s Asian session, its strongest print following its depreciation from the 187.92 area last week. Traders retreated to the 177.23 area after testing an important technical level that represents the 76.4% retracement of the move from 148.91 to 288.87. During the pair’s climb higher, Stops were elected above the 50-bar MA (4-hourly), then indicating around the 176.70 area.
ETH/USD is still trading well shy of the psychologically-important 200.00 figure, and must get through some major technical congestion before testing that area. The 183.33 area is an important upside price objective and that area is also right around the 100-bar MA (4-hourly). Offers are also expected around the 187 – 189 areas and the 191.40 area represents the 50% retracement of the move from 302.20 to 80.60. Selling pressure is also anticipated around the 195 – 197 area and 202.38 level is an upside price objective that represents the 61.8% retracement of the move from 148.91 to 288.87.
Price activity is nearest the 50-bar MA (4-hourly) at 176.36 and the 200-bar MA (Hourly) at 176.55.
Technical Support is expected around 172.88/ 167.80/ 165.25 with Stops expected below.
Technical Resistance is expected around 183.33/ 188.38/ 191.40 with Stops expected above.
On 4-Hourly chart, SlowK is Bearishly below SlowD while MACD is Bullishly above MACDAverage.
On 60-minute chart, SlowK is Bearishly below SlowD while MACD is Bullishly above MACDAverage.
Source link