
Bitcoin (BTC) could decline below $10,000 any time now. This is not matter of if it will happen but when it will happen. We have seen BTC/USD face a strong rejection at the 38.2% fib retracement level. As long as the price remains below this level, the probability of a fall below $10,000 remains very high. Such moves are usually expected around the weekend and it would not be surprising to see something like that happen this weekend as well especially if Bitcoin (BTC) ends up closing the day below the 38.2% fib retracement level. We predicted a move to the upside in BTC/USD which has finally come to fruition or is very close to coming to fruition. Regardless of whether or not the price could still move towards $10,500, it is not worth the risk/reward to chase it.

There are many arguments as to why BTC/USD could fall down from here. The rally was Tether fueled and based on utter manipulation. Even if it weren’t, it still has to correct at some point. Apart from that, we have a strong correlation to the 2014 part of the previous cycle where the price entered a similar symmetrical triangle and then broke below it. In addition to that, Bitcoin (BTC) bulls have been talking about a correlation with Gold. So, what is BTC/USD going to do when Gold (XAU/USD) falls? We have also been talking about similarities to movements in the S&P 500 (SPX). Now that the index is close to topping out, it is not very hard to see what will happen to Bitcoin (BTC) when the stock market crashes because the last time it did, Bitcoin (BTC) broke below $6,000.
In short, all indicators are pointing to a similar crash as we saw around $6,000. We are primed to enter the last half of the bearish cycle now and there are a lot of reasons in favor of the crash compared to those in favor of a new all-time high from here. Those that believe the price could rise towards a new all-time high talk about a bull flag on the weekly chart. We saw how that same “bull flag” led to the price crashing below $20,000 to begin a downtrend. This “bull flag” is one of the main reasons I believe we are yet to see the second half of the bearish cycle just yet.
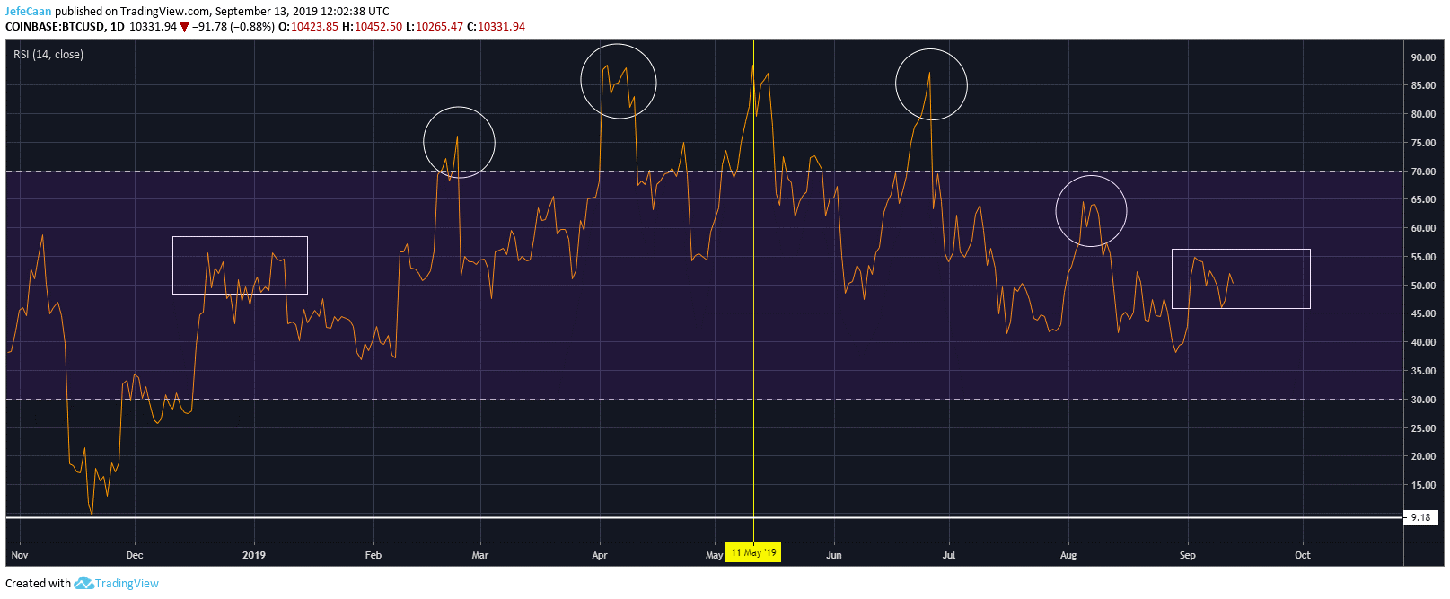
RSI on the daily chart for BTC/USD shows something very interesting. The fractal before us can be divided into two parts that are mirror images of each other. We can see how similar the decline has been to the rise. We are currently in the rectangular box which means that you can expect a lot of confusion in the market before a very sharp decline. We will see the price go up and down while it moves sideways within the symmetrical triangle until it breaks below it to formally kick off the long awaited downtrend.


Leave A Comment