
Ethereum (ETH) has made big moves to the upside over the weekend. You might think that had to do with real buying interest in the market but it was about scaring away the bears before what is to come. If we zoom in on the daily chart for ETH/USD, we see a bearish setup that is very rare to come by. If you are a bear, chances are you are already drooling over your screen looking at this chart. The price ended up testing the 4.55 level again. Now, you might be wondering what is so significant about that level. If we go back and look at the price action from November, 2018 we can see that 4.55 was the support that Ethereum (ETH) declined below when it broke market structure around the same time when Bitcoin (BTC) crashed below ,000.

If this was the only reason that makes this such a wonderful bearish setup, it would still have sufficed as $194.55 is a very strong resistance level. However, if we look at the daily chart there is a confluence of other resistance zones which truly makes this bearish setup golden. There is a trend line resistance that goes back towards the yearly high. In addition to that, there are two support turned resistance trend lines extending back to August. On top of all of that, we have the 38.2% fib extension level serving as strong resistance and the cherry on top is the 50 day EMA. In other words, this setup couldn’t get any more bearish. As more people start looking at this chart, the market makers will become concerned because that means shorts will begin to stack up. They cannot afford that so they will have to help the price crash fast.
A good trade is never easy to make. Short selling Ethereum (ETH) at current prices takes a lot of balls because it could easily break past these resistance levels and then it would be in the clear to rally towards a new yearly high. Most retail traders are in the habit of drawing lines and patterns on a chart and assuming that there is a 50-50 probability of the price breaking to the upside or to the downside. I don’t believe in a 50-50 probability. The odds are never equal and as a good trader you must have the foresight to see what is more likely to happen.
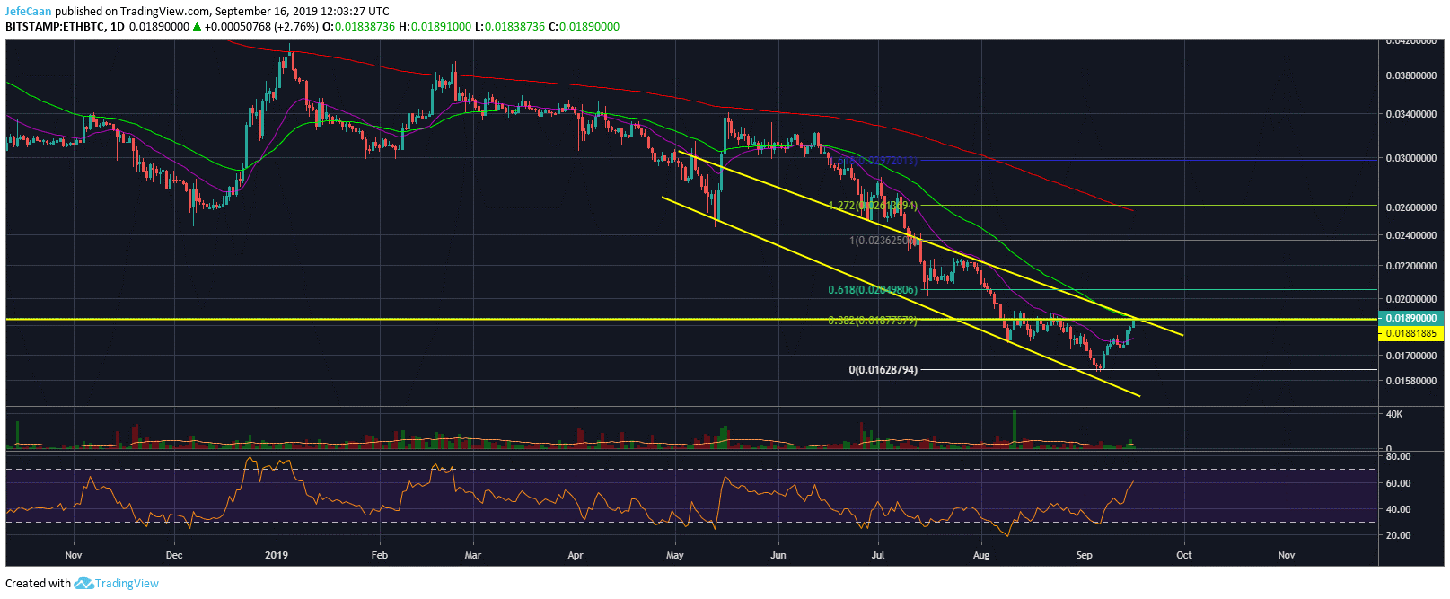
If we look at the daily chart for ETH/BTC, we can see that there is a very high probability that the price has topped out here and is now ready to decline towards the trend line support. It faces a strong resistance not only at the trend line resistance but also the 38.2% fib retracement level. This means that Ethereum (ETH) is not only highly likely to fall against the US Dollar (USD) in the days and weeks ahead but also against Bitcoin (BTC) which will inflict more pain on the altcoin market as well.
Source link