
Bitcoin (BTC) saw a massive decline in price after it failed to close day above the 50 day EMA. This has panicked a lot of bulls who expected the price to rally past ,000 in the days ahead. However, most of the bulls do not realize that this is nothing compared to what has yet to come. These moves are just temporary shakeouts before the price does the inevitable and declines below the descending triangle. The recent move towards the 50 day EMA was aimed at shaking out the bears. As we can see on the daily chart for BTC/USD, the market makers ran their stops and liquidated their positions on the way up and now the price is back where it rallied from ready to do the inevitable. This is why in markets like these it is more effective to be a position trader rather than a day trader.
If you were day trading this market, chances are you may not have an open position at the moment regardless of whether you were bullish or bearish. The insane volatility would have hit your stops and you would be out of a position. I’m sure a lot of traders can relate to this. On the other hand, if you were a position trader, chances are you still have an open position because you know that the move to the downside has to come to fruition sooner or later. While it is tempting to use higher leverage offered by most futures exchanges, the more prudent course of action is to have a working plan and to use leverage that is manageable because things can get out of hand quickly in the market. 65% of the traders are still long on Bitcoin (BTC) and 35% are short which tells us that nothing much has changed.
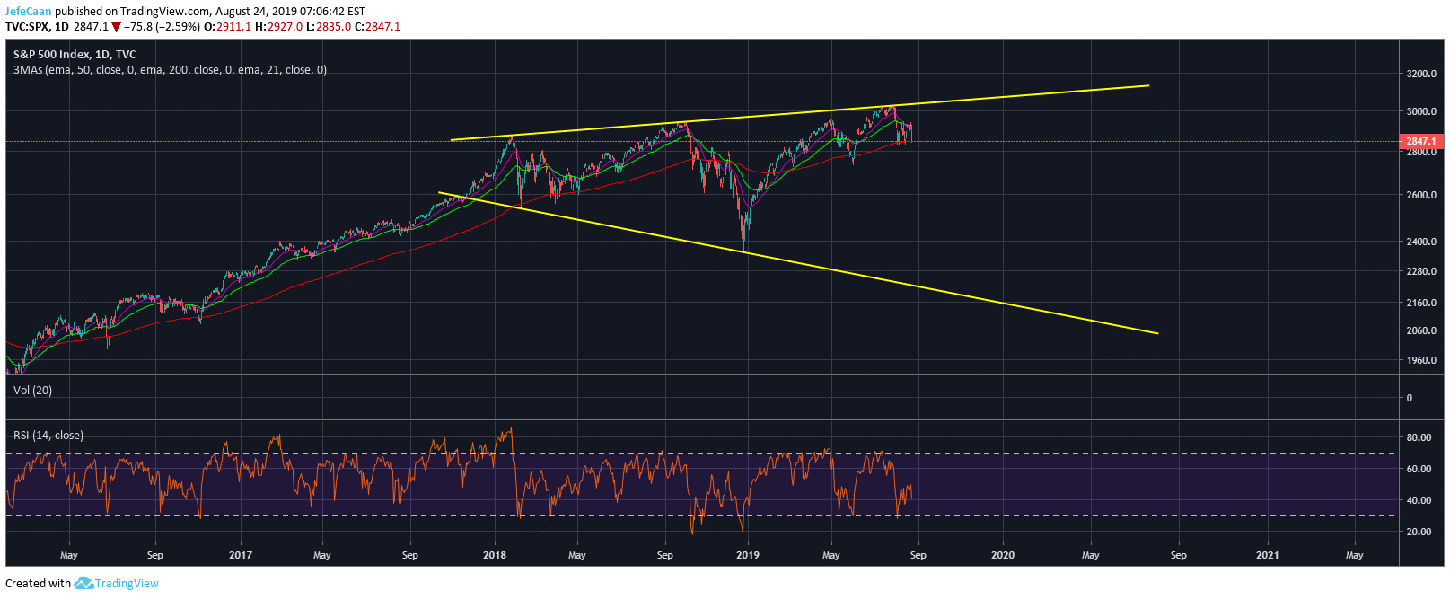
We are not likely to see much of a change in the longs to shorts ratio until the price breaks below the descending triangle. That move is likely to coincide with a decline in the S&P 500 (SPX). The daily chart for the index shows that it closed above the 200 day EMA but it is still quite vulnerable and could begin its decline below the 200 day EMA anytime now. Any bounce to the upside from here would merely delay the inevitable but sooner or later it has to decline.
When the S&P 500 (SPX) declined in October, 2018 we saw BTC/USD prepare for a downtrend which eventually happened and the price crashed hard below $6,000 to form a temporary bottom around $3,130. The S&P 500 (SPX) is now primed for a similar decline which will force BTC/USD to eventually decline below $3,000 to find a bottom around $1,200-$1,800 around June of 2020. That will then pave the way for a multi-year bull trend in Bitcoin (BTC), altcoins and the stock market. While Bitcoin (BTC)’s future prospects may be bright, let us not forget that the worst has yet to come for now.
Source link