Bitcoin (BTC) has a history of repeating certain fractals. They can be easy to find for those that are willing to go the extra mile to do their research. In this case, that fractal is right in front of us. When the price tested the top of the symmetrical triangle the last time before it declined to the bottom of it, the fractal it formed is similar to what is in the making right now. There is the same pattern of rise followed by three tops which is then followed by a decline when the price faces a rejection at the trend line support turned resistance. The last time this happened, the price declined by more than 20%. This time it is expected to decline by at least 12% from current levels.
The 1H chart for BTC/USD shows that the price has failed to break past the trend line support turned resistance as well as the recent high of $10,836. This means that we are very close to the beginning of a sharp downtrend from current levels. When that happens, the bullish resolve is going to weaken quickly which is why the price may not hold the support for long as the market makers would not want the bulls closing their longs. It is in their best interest to liquidate those longs and they are very likely to do that when everyone is buying the dip in anticipation of another move to the upside. There is a head and shoulders in the making on the RSI on the 1H chart for BTC/USD which is very alarming. If this comes to fruition, the price might crash hard from current levels over the weekend.

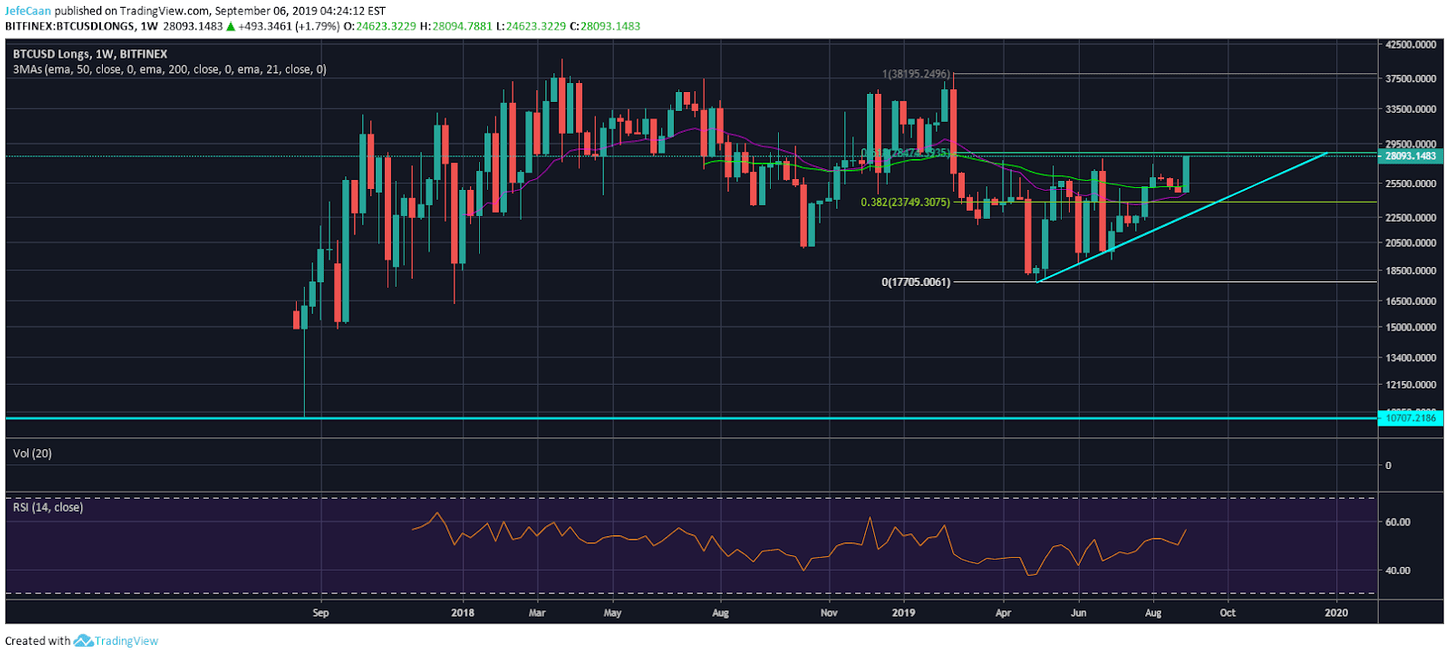
The weekly chart for BTCUSDLongs shows that the bulls are now faced with a strange dilemma. On the one hand, they have reason to be bullish hoping the ascending triangle would break to the upside but on the other hand they have reason to not be bullish because the 61.8% fib retracement could prove to be the point where longs begin to decline. Ever since the launch of Bitcoin Futures, all of this has just been a contracts game. It is all about the derivatives. The whales and market makers keep preying on average retail traders as is the norm in most financial markets.
In the case of Bitcoin, this is prevalent more nakedly because there is no regulation. In the absence of regulation market makers are free to not just provide liquidity but also dictate the direction of Bitcoin (BTC) and other cryptocurrencies because they can without facing any consequences for what would be illegal in regulated markets. Bitcoin longs are close to 70% and Ethereum longs are close to 80%. There is no way the market makers are going to let these people walk away with free money by letting the price break out of the symmetrical triangle to make a new yearly high.


Leave A Comment