
Bitcoin (BTC) has been struggling to break past the $5,445 mark for more than ten hours. The last time BTC/USD broke above out of a similar bullish pennant it made a short lived rally which was followed by significant downside. The price has now clearly broken above the 61.8% Fib retracement level but if it keeps on consolidating again at current levels without forming higher highs and higher lows, the probability of a flash crash would increase. This probable crash would set the ground for BTC/USD printing the same fractal that it has two times now in the recent past. This fractal would see the price finally testing the resistance zone at $5,800-$6,000. It is very unlikely for the price to enter another downtrend without testing this zone.
The bears have become too confident too fast. The number of margined shorts keeps on piling up and most retail bears have been expecting the price to fall since it was trading around $5,000. If the price keeps on rising and hits the $5,800-$6,000 mark, it could lead up to a brutal short squeeze and most retail bears are going to be forced out of their positions which will push the price of Bitcoin (BTC) higher. That being said, this is a strong resistance zone and there are a lot of sellers in this area which means any effects of a short squeeze are likely to be offset by the whales dumping on over-enthusiastic bulls. The best case scenario for market makers and whales is to give both the retail bulls and bears a run for their money. By staging a short squeeze they first put the bears out of business and then trap the bulls in just before they dump on them.
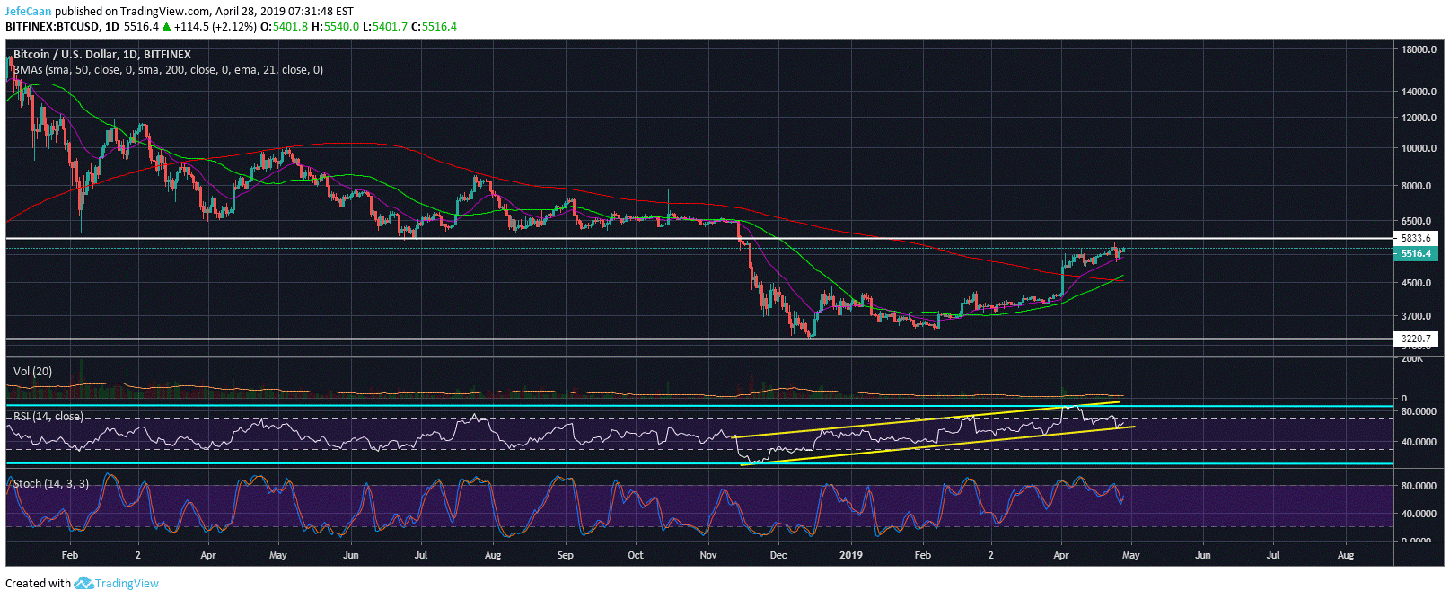
The daily chart for BTC/USD shows that the price still has plenty of room to rally towards $5,800-$6,000. It is very important for the price to test this level. It will provide clarity to the bulls and bears to go long and short depending on how the price tests this level. Certainly, our views remain unchanged and we expect BTC/USD to fall to $1,800 or lower levels in the months to come. This has more to do with financial developments on a macro scale than Bitcoin (BTC) itself. Let us not ignore the fact that BTC/USD has not been this overbought on the weekly time frame since the beginning of the bear market.
Can the price rally from here and break the toughest resistance zone under such overbought conditions? I don’t think so. That being said, I would not be surprised by any manipulation to lead the mainstream into thinking it can break past this resistance zone or it has. The big picture is very clear on larger time frames and short term price manipulation is not going to change anything except for the sentiment of unsuspecting retail traders who always end up losing money. The next move towards $5,800-$6,000 is likely to get a lot of people very excited. RSI and Stochastic indicators on the daily chart show that the price is very likely to make that move. However, both the bulls and the bears need to be very cautious about entering a trade here. It is important to be right about the direction of Bitcoin (BTC)’s next move but it is more important to be right about the timing.


Leave A Comment