
Bitcoin (BTC) has resumed its uptrend and is now on its way to climb above the 21 Day EMA just as it did after the parabolic uptrend of 2017. Currently, it is struggling to break past resistance in the $10,800 zone. Soon as it breaks past it, BTC/USD will have to run into another resistance around $11,040. The price is now close to completing this move and we expect it to stop around $11,600 before it begins its downtrend. Even though the price has already closed above the 50 Day EMA and is now likely to climb above the 21 Day EMA, investors still need to realize that the price is due for a sharp decline soon as it tops out here. The last time the price climb above the 21 Day and tested the 61.8% fib retracement from the second top, it ended up beginning a strong downtrend.
Considering that the price has completed a similar parabolic uptrend, we expect it to correct in the same manner that it did after the parabolic advance of 2017-18. If we take a look at the RSI, we have seen it break out of a critical downtrend and is now in the clear to shoot up. The same goes for the NVT indicator on the daily chart which is once again eyeing a reversion to the mean. If the NVT indicator fails to break above its RMA, we can expect the price to decline soon as it touches it. The same goes for the 61.8% fib retracement level from the local double top. If the price ends up touching $11,600, it is time to expect a downtrend. It is important to note though that all of a sudden people are very bearish on Bitcoin (BTC) again.
When we first posted that BTC/USD could see further upside, the price was below $10,000. It showed strength and the bulls were determined to take it higher. Furthermore, the sentiment was overly pessimistic which convinced us that a short term trend reversal was in the offing. The Fear and Greed Index started to rise soon afterwards but it has started to decline once again and is currently down eight points from yesterday at 34 (fear).

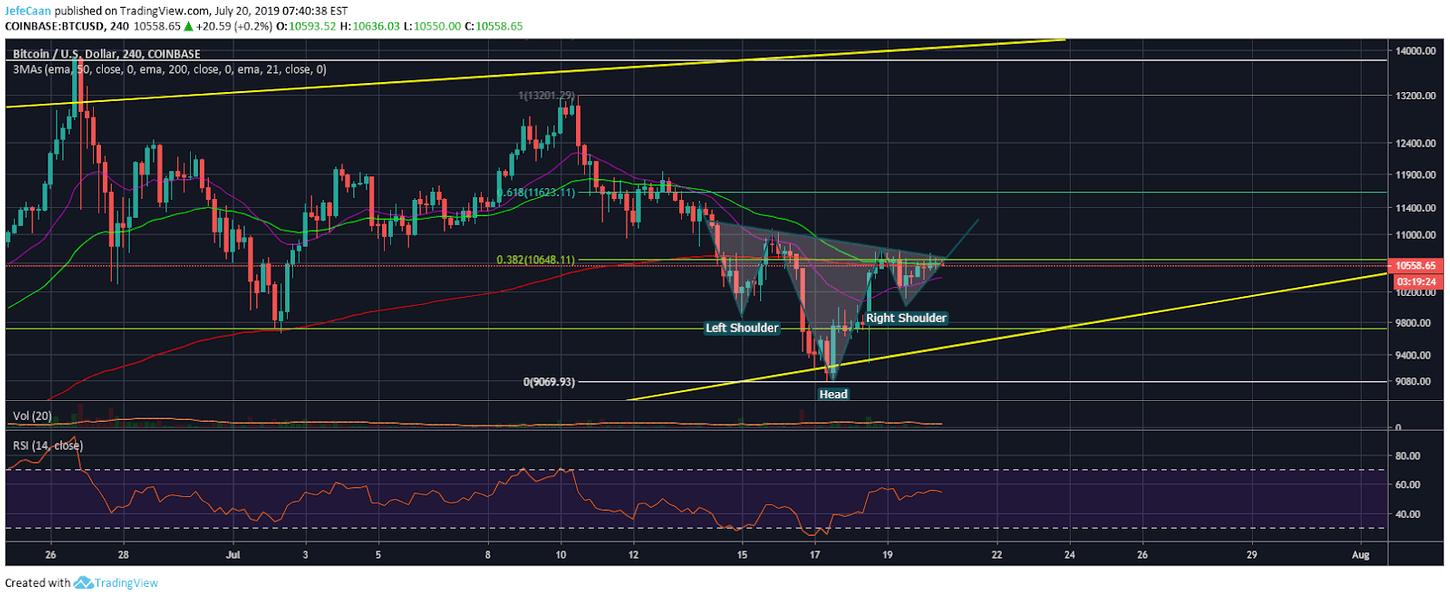
If we take a look at the 4H chart, we could say that this fear is misplaced because we see an inverted head and shoulders formation that could quite easily come to fruition. In fact, it would not be surprising to see this complete this weekend or in the first few days of next week. Point is, the price has room to rally before it tops out but investors need to be aware of the risk. If we see the IH&S come to fruition, a lot of people will be very excited all of a sudden expecting altcoins to rally before Litecoin (LTC)’s next halvening and that is when we are most likely to see the beginning of the long anticipated downtrend.


Leave A Comment