“Sell in May and go away” is a popular adage on Wall Street and a long used investment strategy. Historically the S&P 500 has performed better between November and April compared to other months. A lot of investors who manage their own stock portfolios and do not have any specialized investing expertise rely on such seasonality patterns to buy and sell. Everyone likes to take a summer break and Wall Street is no stranger to such breaks. Most professionals go vacation between May and August which means they would not want to worry about their investments while they are away. So, most of them end up selling in May as they go away. Considering that a lot of people on Wall Street are involved in Bitcoin (BTC) this time and that BTC/USD reacts strongly to the S&P 500 (SPX), we could see a sharp decline in the price of Bitcoin (BTC) between May and October.
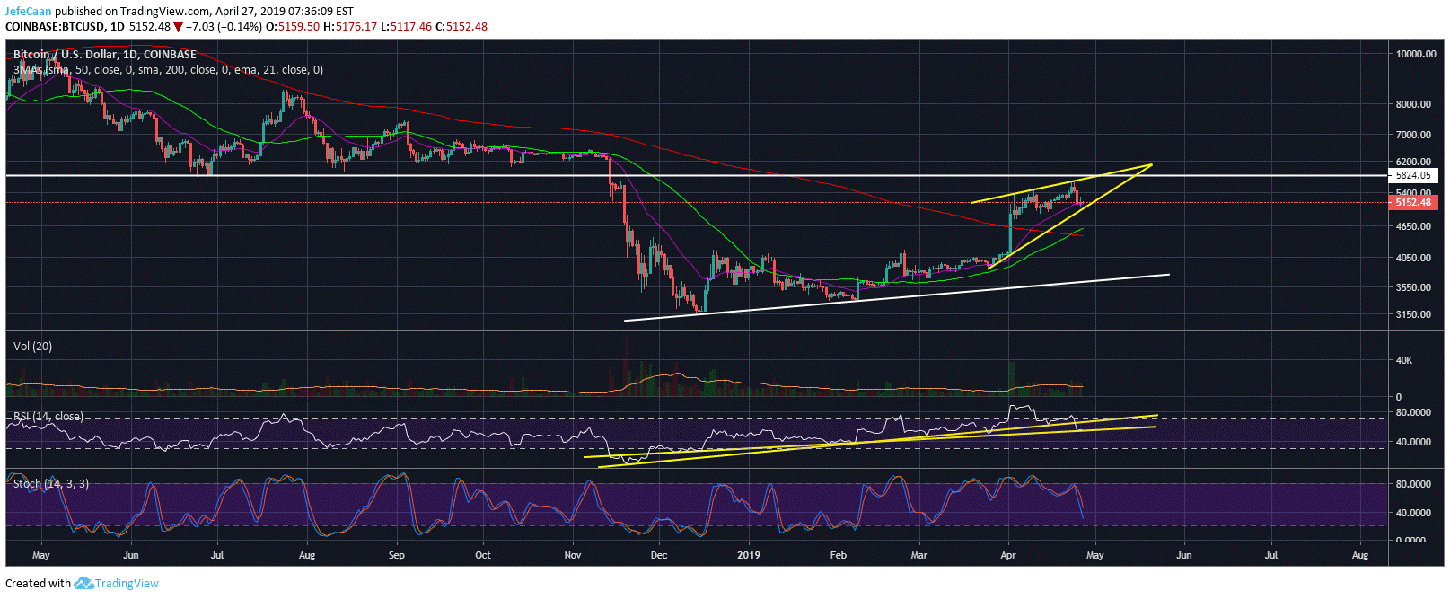
If we look at the above daily chart for S&P 500, we can see that it started to decline aggressively in November, 2018. The index continued to decline till it found a temporary bottom in December, 2018. If we look at the price of Bitcoin (BTC) around this time, it broke below $5,800 and made new lows for the year as it settled around $3,128. The price of Bitcoin (BTC) rallied from there following in the footsteps of the S&P 500. While BTC/USD has been rallying in a rather confused manner, the S&P 500 has been surging with confidence since then. Interestingly enough, the price is now out of room to trade within the rising wedge it has been trading in. This means that we are on the verge of a strong breakout in the S&P 500. Considering that the index is heavily overbought on the daily time frame and that rising wedges usually break to the downside, this would be the catalyst for the upcoming “Sell in May and Go Away.”

For investors in equities, the situation is very clear as this would be the perfect time to get out. However, Bitcoin (BTC) investors are still facing a dilemma as the price still has room to retest the previous market structure around $5,800-$6,000. If we look at the RSI on the daily chart for BTC/USD, we can see that one of the trend line supports has been clearly broken. However, if we look at the other trend line, it seems that the price could still make one last move to the upside.
This confusion can be seen on different levels. BTC/USD formed a golden cross recently when the 50 day moving average crossed above the 200 day moving average but we have yet to see the price capitalize on that. Recent events in the cryptocurrency market have made the game plan a little easier to comprehend. The Tether and Bitfinex controversy might lead to investors turning their USDT into Bitcoin (BTC) so they can cash out into fiat. This would be the perfect setup to see a retest of the previously broken market structure around $5,800-$6,000 followed by a sharp pullback. This would allow BTC/USD to catch up with the S&P 500 before both of them decline steadily in the months ahead.


Leave A Comment