
Bitcoin (BTC) has been stalling another move to the downside for the past two days which was reasonable to expect after the massive crash from ,947. However, the manner in which the price kept surging led some investors into thinking that maybe the price had bottomed and was now ready to begin a bull trend. As we can see on the 15 min chart for BTC/USD, this was just a bear flag in the making which ended up coming to fruition today when the price crashed below it. At the moment, it is consolidating around the ,400 mark. We may see this sideways movement in BTC/USD continue for a day or two but it a big move to the downside is only a matter of time.

There are traders who don’t agree with this approach. To them, a breakout is a 50-50 deal so; they would expect the price to have a 50-50 probability of breaking above or below a certain pattern. I do not agree with that approach. I think there has to be some logic and foresight to investing otherwise it is just gambling. It is for this reason that I do not agree that there is a 50-50 chance of the price breaking above or below the large symmetrical triangle that we currently see on larger time frames. We have been talking about this symmetrical triangle for the past few weeks and we contend that the price has a much higher probability of breaking to the downside than to the upside. If you want to find the odds for that, you might want to take a look at the longs vs. shorts ratio for BTC/USD which is currently 65-35 in favor of the bulls.
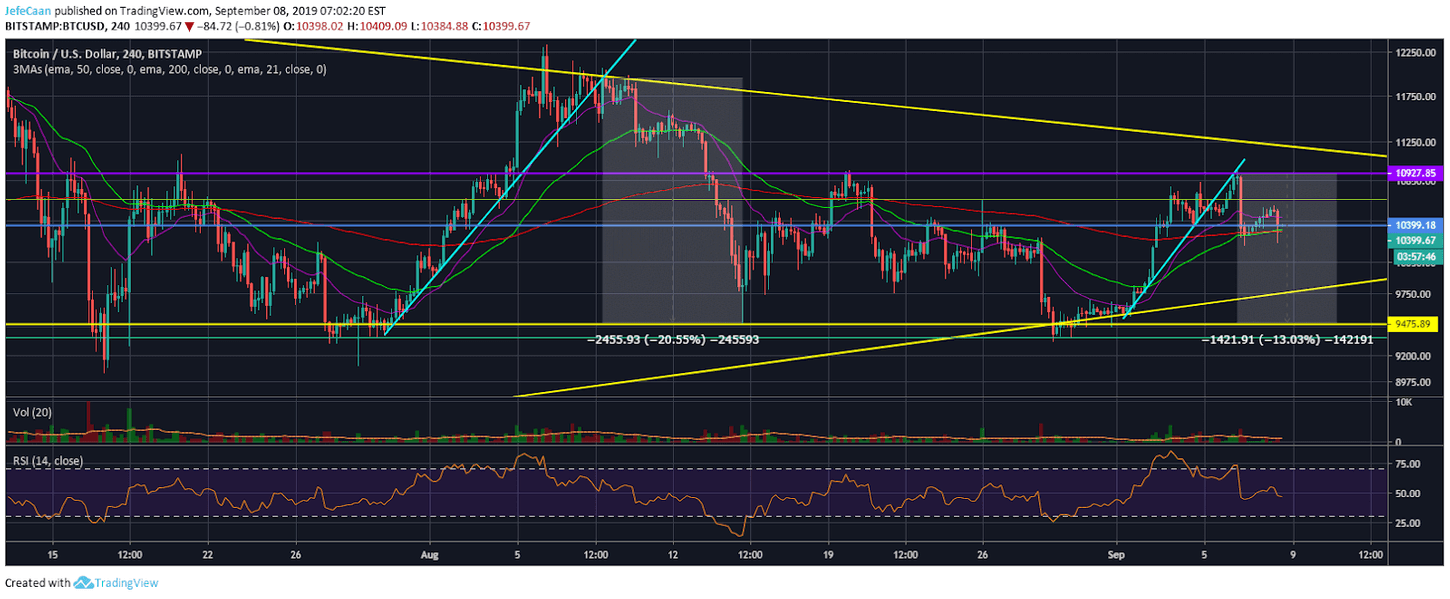
Bitcoin (BTC) has started its decline in the same manner that it did in August after it ran into a trend line support turned resistance. It declined more than 20% from there while we expect the current decline to be around 13% before temporary upside follows. If you look at the two fractals, the similarities are striking. We predicted this move to the downside while the price was trading around $10,889. Since then it has declined exactly as we expected and now it is likely to see some short term sideways movement before the big move below $10,000.
The 4H chart for BTC/USD shows that the price did attempt to decline from current levels but it soon shot back above the 200 EMA on the 4H chart. This tells us that the price is not prepared to decline just yet because the bulls are busy buying the dips and the market makers want them to keep doing that. When they run out of people who will buy the dips, they’ll crash the price quickly and aggressively so the shorts (bets that the price will go down) don’t stack up. Panic selling will follow from there and the price will tank hard in the coming weeks and months. As the old adage in financial markets goes, “bulls go up the stairs but bears get out the window.”
Source link