
There is a descending triangle on the BTC/USD chart that everyone is looking at. For the bulls this is a sign that the move to the upside may be short-lived whereas for the bears this is a sign of confidence that the price might soon start decline. In my opinion, before that happens, both sides are going to be surprised. When the price started to shoot straight past $6,000 and made a parabolic run from there, the bulls and bears were both very surprised. The same could happen this time if the descending triangle is broken to the upside. The bulls would be surprised but confident and the bears would be surprised and disappointment which is exactly what the market makers want. From a game theory standpoint, I think we are more likely to see the price break to the upside from here invalidating this descending triangle.

The price has already been consolidating for the past 24 hours and is now on the verge of a rally past the 21 EMA on the 4H chart. This would be a bullish development and we might soon see a retest of the top of the descending triangle. The RSI shows that there is plenty of room for the price to rally higher from here. The bulls needed the price to hold its ground above $9,000 and so far it has been very successful at doing that. If we see a weekly close above current levels, we would have further confirmation that further upside is likely from here. The symmetrical triangle on the BTC/USD chart still remains intact and if the price ends up breaking the descending triangle then many traders would expect it to break the symmetrical triangle as well to rise towards a new all-time high.
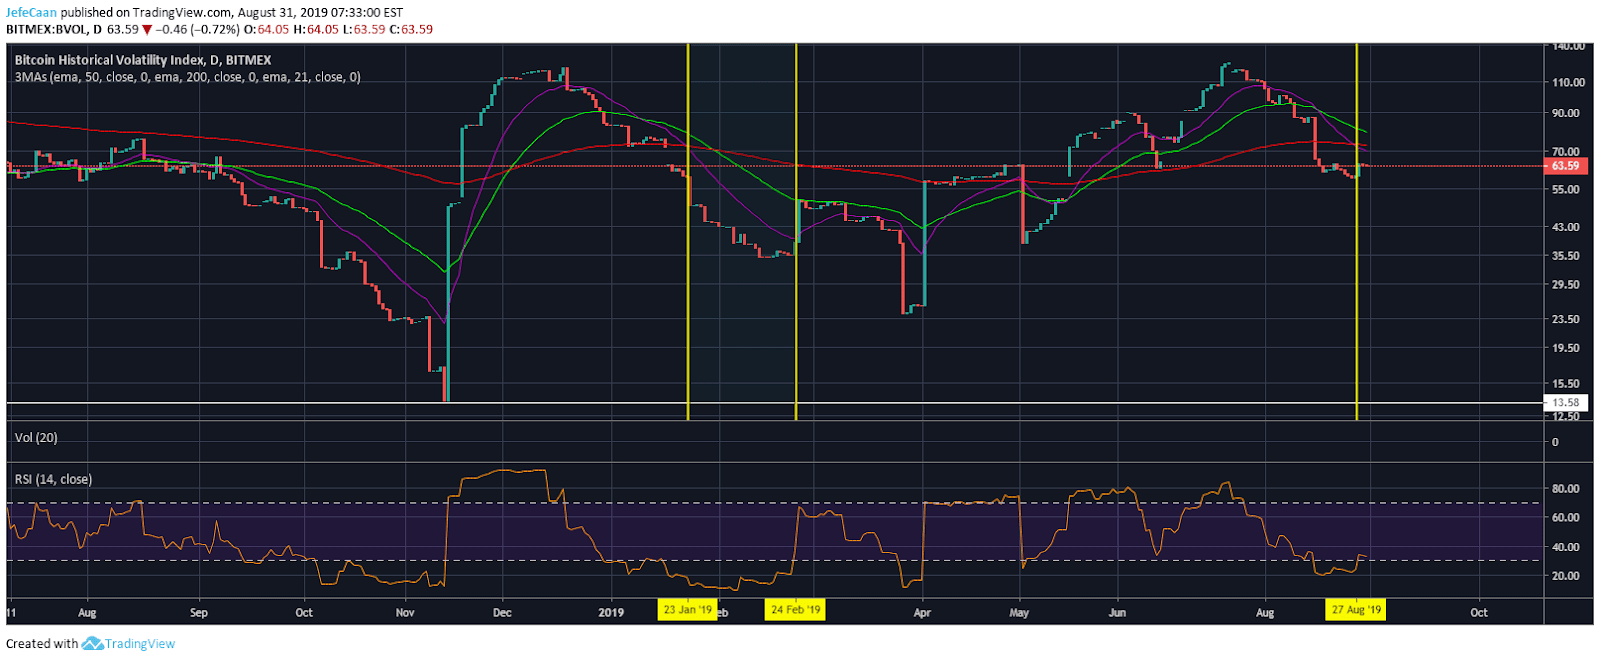
Bitcoin Historical Volatility Index (BVOL) has been in a decline for the past few weeks but this time we have seen the 21 EMA break below the 200 EMA which means a rapid decline in volatility might follow from here in the near future. All this means is that the price may keep on rallying higher in a sluggish manner but a big move will await soon after that just like it did during April when the volatility finally started to rise again.
The big move in Bitcoin (BTC) is the one that we expect to drag the price down to begin its downtrend. This has to happen sooner or later and that is when BTC/USD will begin the next downtrend that will see it decline below $3,000 to find a potential bottom between $1,200 and $1,800. The market is taking longer this time to make these moves but we expected this because this market cycle is longer than the previous one as more money has to leave the market just as more money had to enter the market. It would not be surprising to see BTC/USD continuing its correction even for the most part of 2020 but for now it is due for further upside from here and it is very likely to get it.


Leave A Comment