
Ethereum dominance has finally topped out and is now signaling imminent downside in Ethereum (ETH). This is the chart that we have been looking at for a long time and we can see that for more than a week now Ethereum dominance (ETH.D) has done nothing but traded sideways. We have now seen a sharp move to the upside with the beginning of this week but all it has done is test the 61.8% fib retracement level again and has now run into the previously broken trend line support which was part of a rising wedge and has now become a strong trend line resistance. If dominance starts to decline from here, we would see a very sharp decline in the price of Ethereum (ETH) because investors would be convinced that Ethereum dominance (ETH.D) has topped out and is about to enter a downtrend.

The only way Ethereum dominance (ETH.D) enters a downtrend is when there is a big move in Bitcoin (BTC) or we have a sharp overall decline in the market. In the former scenario, we have an equally bearish situation because most of the time we have seen a rise in Bitcoin (BTC) against altcoins followed by a sharp decline in the overall market. The way this works is that money flows out of altcoins into Bitcoin (BTC) and then out of Bitcoin (BTC) into fiat bringing down the price of Bitcoin (BTC) and with it other cryptocurrencies as most coins dance to the tune of Bitcoin (BTC). So far, there is a very high probability that we might see a sharp decline from current levels because Ethereum dominance has failed to break past the key 61.8% fib retracement level.
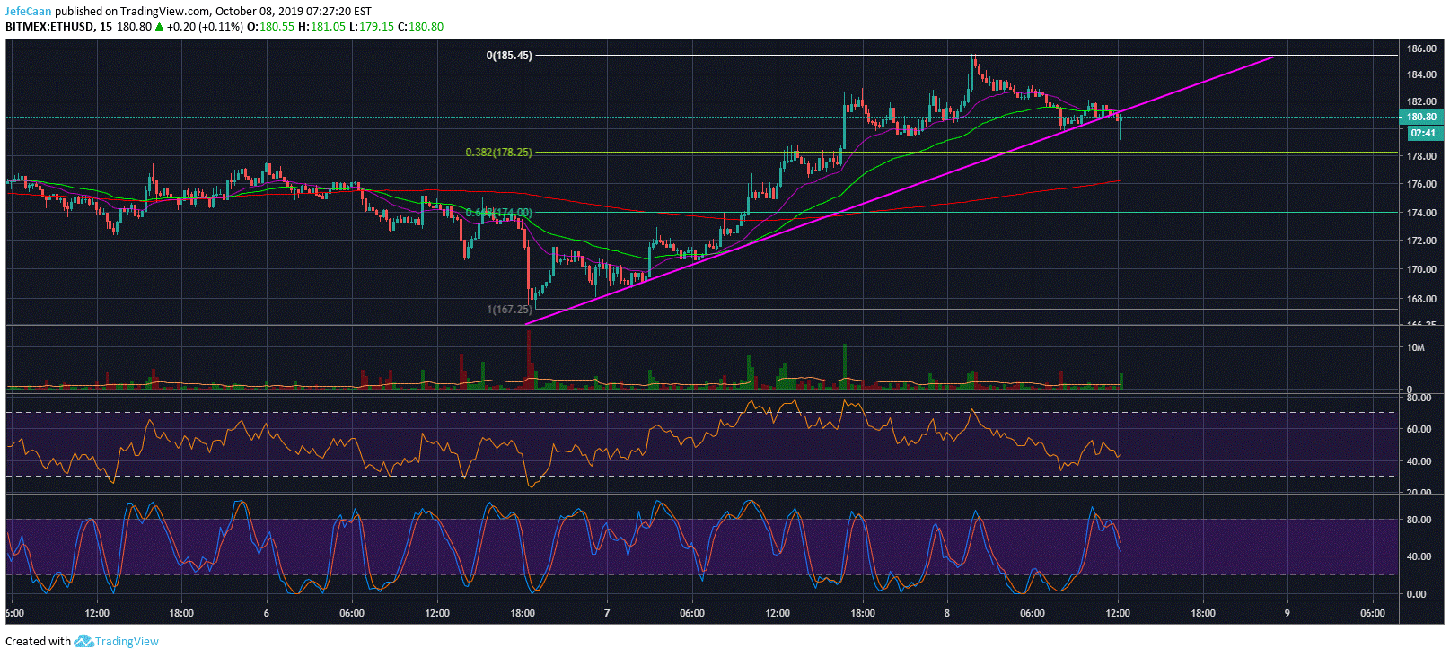
On the shorter time frame, we can see that there is a lot of room for Ethereum (ETH) to decline against the US Dollar (USD) now that it has broken below a key trend line support. We have seen a quick bounce up after the sharp decline erasing most of the losses but that does not change much as the cat is out of the bag now and we can see what is really happening. All of this short term noise is consequential. These are just orchestrated attempts to confuse day traders.
The 15 min chart for ETH/USD shows the potential targets we can expect the price to decline to in the near future. It may find short term support on the $178.25 level but it is expected to eventually decline lower down to the $174 level to begin its downtrend from there. I expect ETH/USD to take out the previous lows as it declines below $150 in the weeks ahead. The S&P 500 (SPX) and EUR/USD will play a key role in determining the time frame of this move as always but in my opinion it is a matter of when and not if it will happen. Investors need to be very careful about buying the dip here because things could change very quickly especially if we big moves in larger financial markets.


Leave A Comment