
Ethereum (ETH) continues to show signs of weakness as the price struggles to take off towards $160 from current levels. For the past three days, the price has failed to make any meaningful moves and is now likely to attempt to rally towards the top of the descending triangle it is trading in. This descending triangle forms part of a large rising wedge that will eventually have to the break to the downside. That being said, ETH/USD has a lot of room to rally short term as the RSI has cooled off and the stochastic indicator signals a bullish crossover that could see the price rally towards its trend line resistance in the days and weeks ahead. This rally is extremely unlikely to break past the downtrend resistance as the bullish momentum is fading and the bear are eager to take control.
The daily chart for ETH/USD shows that the price is currently trading at the lower extremities of the Bollinger bands with the 50 day simple moving average as its support. This means that the price could attempt to rally towards the 21 day EMA in the days ahead. If it succeeds in breaking past it, we might see a retest of the trend line resistance. So far, the price has been successful in turning some critical resistances into support and it seems unlikely for ETH/USD to fall below $150 anytime soon. A rally towards $160 will increase the probability of a retest of the top of the rising wedge but considering that the bullish momentum is fading away, it may not follow through. In fact, the price is likely to face a strong rejection at the trend line resistance of the descending triangle which might eventually push it below the rising wedge to begin its decline towards $60.
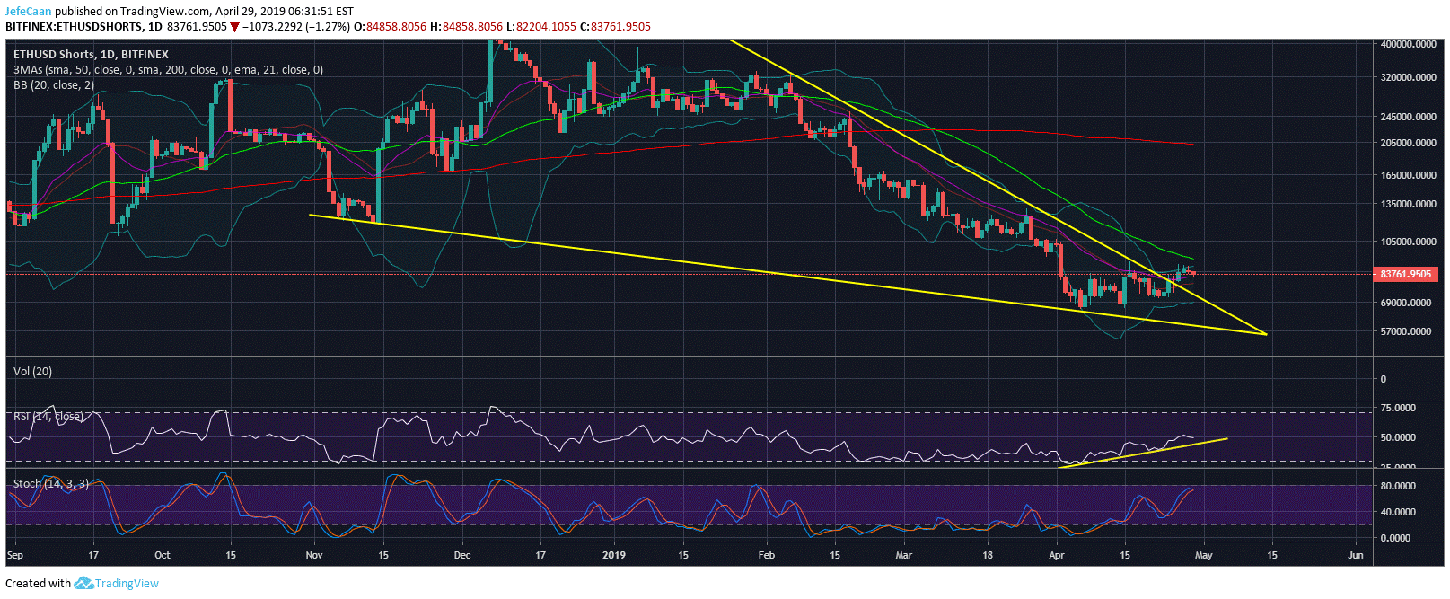
The daily chart for ETHUSDShorts shows that there is plenty of room for the bears to push back but it appears that the number of margined shorts against ETH/USD could fall as Ethereum (ETH) struggles to rally towards $160 in the days ahead. ETHUSDShorts has now formed four candles at the top of the Bollinger bands and is likely to retrace towards the trend line resistance turned support. Both the RSI and Stochastic indicators support this move.
Even if ETHUSDShorts continues to linger around these levels for a few more days, it is likely to eventually be pushed down after facing a rejection at the 50 day moving average. As Bitcoin (BTC) goes down, altcoins like Ethereum (ETH) go down a lot harder. The converse is not true at this point because Ethereum (ETH) like most other altcoins has already tested its previous market structure and faced a strong rejection whereas Bitcoin (BTC) has yet to do that. The fact that Bitcoin (BTC) has a lead over most altcoins also means that cryptocurrencies like Ethereum (ETH) could see new lows against Bitcoin (BTC) before the bear market comes to an end.


Leave A Comment