Ethereum (ETH) is trading just below the $300 mark and investors are all excited about a rally to $500 or $1500 without even realizing what is going on and what the big picture tells us. The problem with most analysts is that they make all-time high predictions on the 1H chart. How could you predict a rally to an all-time high on the 1H time frame? Traders use different time frames because they have their own distinct purpose. If we look at the monthly chart for ETH/USD, there is no way a 1H chart or even a 4H chart can put the big picture as clearly as we see it here. In trading and chart analysis, it is often best to keep things as simple as possible. If we look at this chart, it is as simple as possible. There is one line that cuts the fractal into two.
This horizontal line used to be a strong support. The price broke below this support around August, 2018 but we had adequate confirmation in September, 2018. Now, here is the thing. When a horizontal support that has held on for so long breaks to the downside, you cannot just expect the price to cut through it like a knife through better. Now, one might argue that we saw similar events around $6,000 when Bitcoin (BTC) did appear to have violated all technical analysis and cut through the strong resistance in that manner. That is true, and yes it did happen but we need to realize that this is different than that in many ways. The price is easy to manipulate on smaller time frames but when it comes to larger time frames, like the monthly, this is what the big investors who don’t care about day trading use. Now, you can rest assured that there are a lot of sell orders around that line. Last month, we saw some overzealous bulls try to break this resistance, but we can see how that turned out as the candle closed the month below this resistance.

Ethereum (ETH) and other cryptocurrencies shook out a lot of retail traders during the first phase of the bear market. That was significant but it was easy to see that coming. A lot of people got in at the top and they kept holding their bags while the whales dumped on them. That was pretty straightforward and the bulls and bears were very simply divided there. The bears expected a correction and the bulls expected a continuation of the trend.
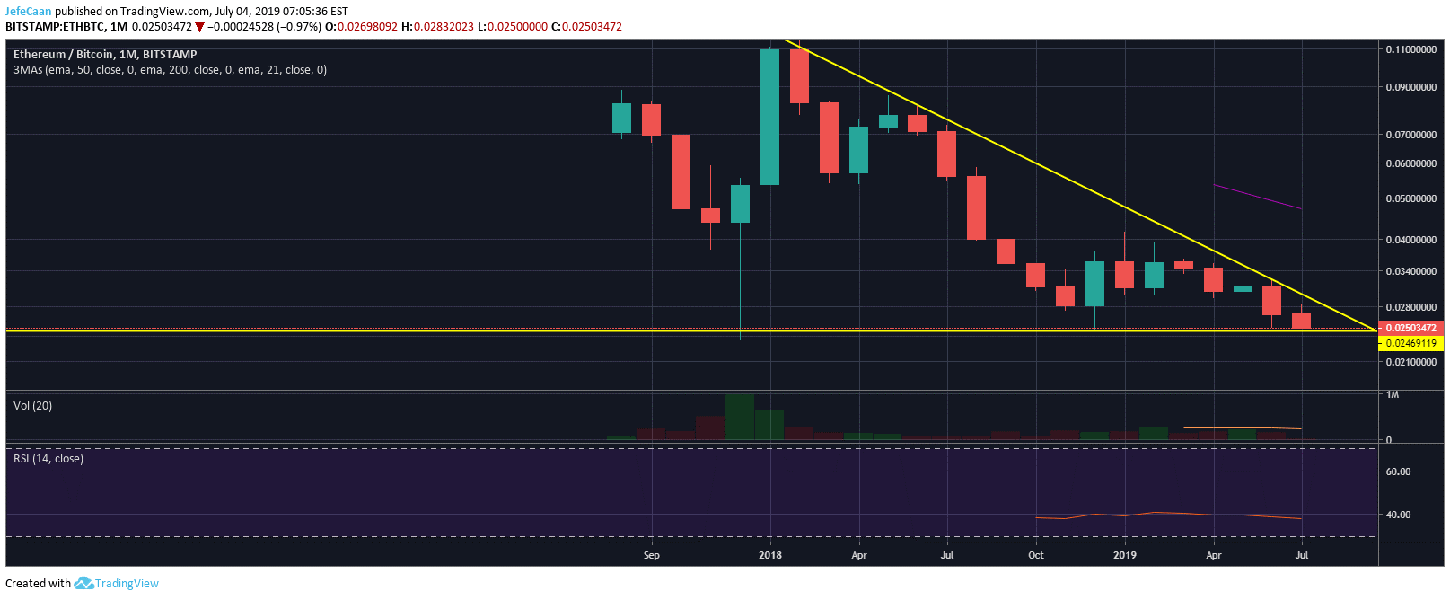
However, this time the situation is a lot trickier. We have even some of the most well respected analysts and chartists expecting a rally to a new all-time high despite the massively overbought conditions and all the bearish signals. If we look at the monthly chart for ETH/BTC, the pair is close to just breaking below the descending triangle. If this happens and Ethereum (ETH) breaks this key support against Bitcoin (BTC), altcoins are going to be obliterated. So, there are many reasons to be bearish on Ethereum (ETH) at the moment but even if you refuse to believe that, you would be better off to at least acknowledge that there is no reason to be bullish just yet.


Leave A Comment