
Bitcoin
Bitcoin (BTC/USD) was slightly stronger early in today’s Asian session as the pair traded as high as the 9618.59 area with traders searching for direction. There was some very interesting trading activity late in yesterday’s North American session that saw selling pressure take the pair as low as the 9436.20 level before moving higher to the 9704.48 and then consolidating intraday gains. Traders are still observing the 9765.93 area as an upside price target, a level that represents the 38.2% retracement of the move from 3128.89 to 13868.44.
BTC/USD is showing a little bit of upward traction following its recent move to the 9321.73 area from the 10680.00 level this past week. The 50-bar MA (4-hourly) continues to move lower and is now indicating at 9927.07, below the psychologically-important 10000 figure. Around that level, chartists are observing some likely selling pressure around the 9938.16 level, representing the 61.8% retracement of the 7508.77 – 13868.44 range. Additionally, there are Offers expected between the 10046 and 10087 levels, with additional selling pressure expected between the 10234 – 10268 levels.
Price activity is nearest the 50-bar MA (4-hourly) at 9927.07 and the 50-bar MA (Hourly) at 9,567.54.
Technical Support is expected around 9,265.49/ 8,919.72/ 8,488.00 with Stops expected below.
Technical Resistance is expected around 9,964.93/ 10,101.47/ 10,238.00 with Stops expected above.
On 4-Hourly chart, SlowK is Bullishly above SlowD while MACD is Bullishly above MACDAverage.
On 60-minute chart, SlowK is Bearishly below SlowD while MACD is Bullishly above MACDAverage.
Ethereum
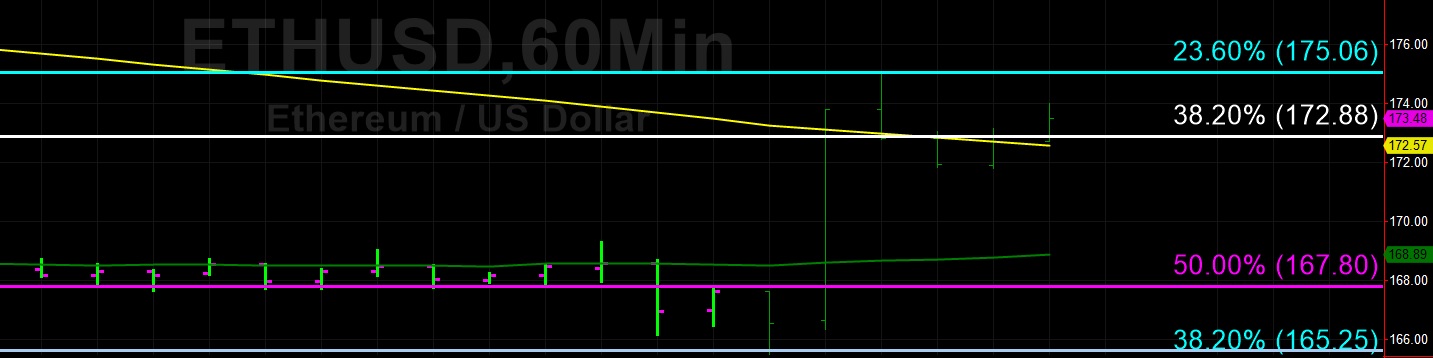
Ethereum (ETH/USD) gained a little bit of ground early in today’s Asian session as the pair moved higher to the 175.00 figure following a move to the 165.50 area late in yesterday’s North American session, right around an important technical level that represents the 38.2% retracement of the move from 302.20 to 80.60. Stops were elected above the 173.80 area during the pair’s move higher late yesterday, right above the pair’s high following its significant decrease from the 187.92 area.
During ETH/USD’s move higher, traders pushed the pair above the 50-bar MA (hourly) and above the 100-bar MA (hourly). Traders are looking to see if the pair can establish a base above the 172.88 area, an important level that represents the 38.2% retracement of the 322.16 – 80.60 range. If traders are able to also push the pair above the 175.06 level, traders may be able to challenge the 100-bar MA (hourly), currently indicating around the 180.83 level.
Price activity is nearest the 50-bar MA (4-hourly) at 180.42 and the 50-bar MA (Hourly) at 168.89.
Technical Support is expected around 165.25/ 152.08/ 142.22 with Stops expected below.
Technical Resistance is expected around 178.77/ 181.84/ 187.46 with Stops expected above.
On 4-Hourly chart, SlowK is Bullishly above SlowD while MACD is Bullishly above MACDAverage.
On 60-minute chart, SlowK is Bearishly below SlowD while MACD is Bullishly above MACDAverage.
Source link