
Litecoin
Litecoin (LTC/USD) was rangebound early in today’s Asian session as the pair traded as high as the 56.24 level after trading as low as the 55.23 area during yesterday’s North American session. Traders continue to monitor price activity around some key levels including the 59.97 area, representing the 23.6% retracement of the 182.35 – 22.17 range. The markets crashed below this area on 24 September en route to its recent low print of 50.25 and LTC/USD will need to recover and become constructive above this area if positive sentiment will emerge in the medium-term. A couple of additional levels that traders are monitoring include the 57.33 and 61.71 levels, representing the 23.6% and 38.2% retracements of the recent 80.26 – 50.25 range. Above current market activity, the 65.26 and 68.80 levels are also areas of potential technical Resistance related to the same range.
Additionally, the 62.58 area represents the 38.2% retracement of the 127.95 – 22.17 range and is likely to pose some technical Resistance, while the 62.46 area is the 23.6% retracement of the 192.89 – 22.17 range and is also likely to be some technical Resistance. Price activity has moved above the 50-bar MA (4-hourly) and is now trading above the 50-bar MA (hourly), 100-bar MA (hourly), and 200-bar MA (hourly).
Price activity is nearest the 100-bar MA (4-hourly) at 56.11 and the 50-bar MA (Hourly) at 56.25.
Technical Support is expected around 55.44/ 50.25/ 47.13 with Stops expected below.
Technical Resistance is expected around 62.58/ 69.47/ 75.06 with Stops expected above.
On 4-Hourly chart, SlowK is Bullishly above SlowD while MACD is Bearishly below MACDAverage.
On 60-minute chart, SlowK is Bullishly above SlowD while MACD is Bearishly below MACDAverage.
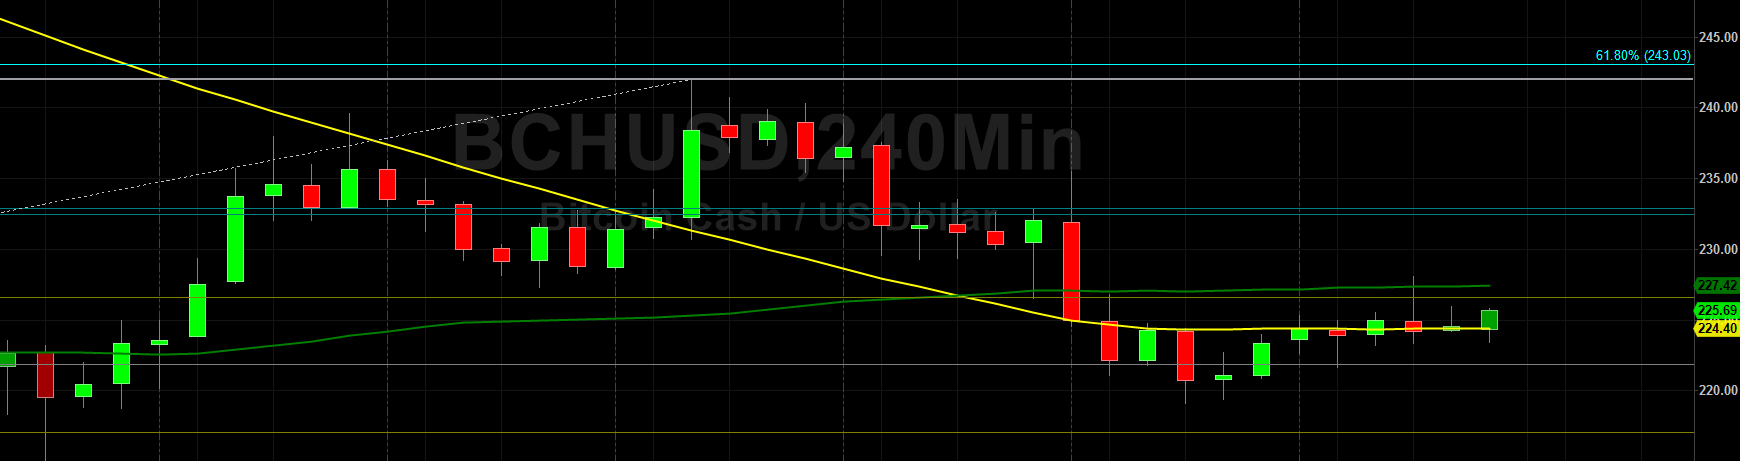
Bitcoin Cash
Bitcoin Cash (BCH/USD) was largely unchanged early in today’s Asian session as the pair traded as high as the 225.67 after trading as low as the 221.65 area during yesterday’s European session. The pair has been moving around the 221.83 area, a level just below the 100-bar MA (4-hourly) that also represents the 50% retracement of the 201.66 – 242.00 range. Some additional retracement levels related to this range include the 217.07 and 211.18 areas. Notably, the market stopped just short of testing the 243.03 area this week, representing the 61.8% retracement of the move from 73.22 to 517.75.
Before BCH/USD can make a break above the 243.03 area, traders will see if markets can become constructive above the 232.88 area, representing the 23.6% retracement of the move from 333.93 to 201.66. Additional areas of potential technical Resistance include the 252.19 and 267.80 areas. Significant Stops were elected below the 265.55 area during the plunge lower from the 333.93 area in late September, and chartists will closely monitor price activity around this area.
Price activity is nearest the 200-bar MA (4-hourly) at 307.79 and the 50-bar MA (Hourly) at 297.83.
Technical Support is expected around 194.55/ 178.13/ 164.19 with Stops expected below.
Technical Resistance is expected around 243.03/ 252.19/ 267.80 with Stops expected above.
On 4-Hourly chart, SlowK is Bullishly above SlowD while MACD is Bearishly below MACDAverage.
On 60-minute chart, SlowK is Bearishly below SlowD while MACD is Bullishly above MACDAverage.


Leave A Comment