
Bitcoin
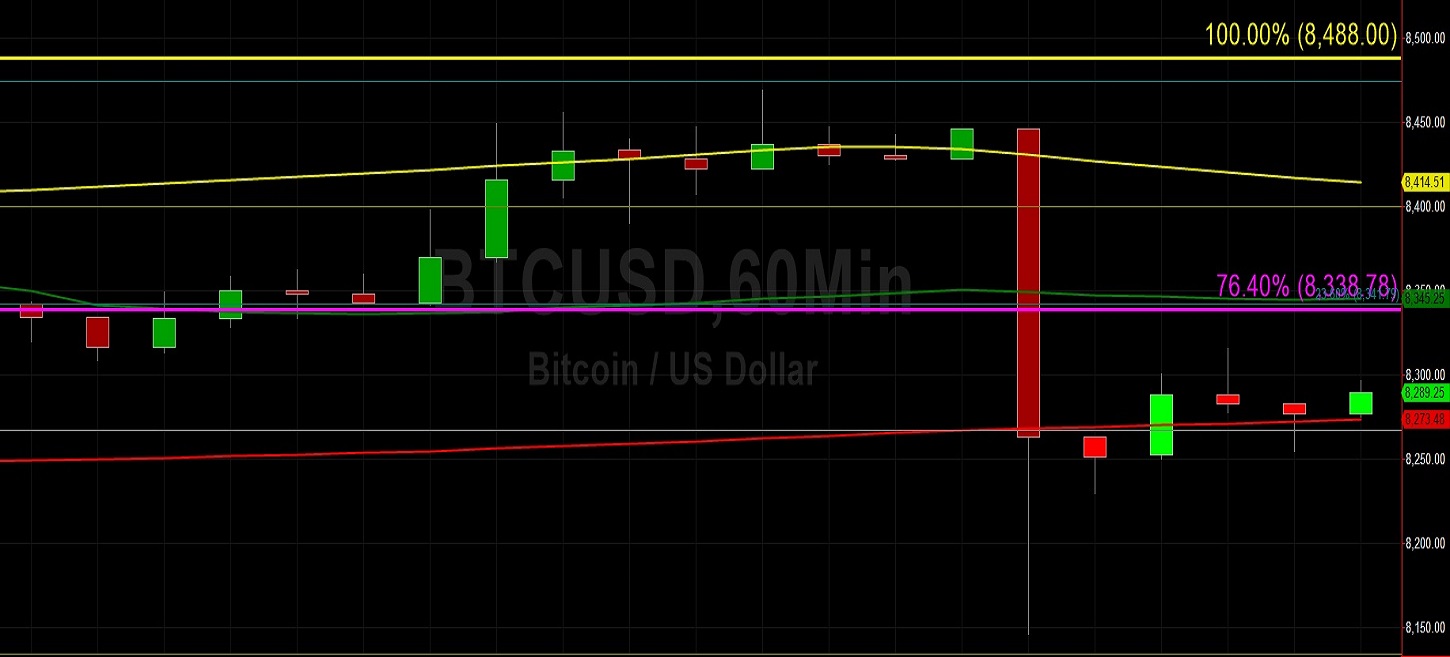
Bitcoin (BTC/USD) recovered early in today’s Asian session after a major depreciation saw the pair decline rapidly from the 8446.03 level and test the 8146.07 area. Stops were elected below the 8282.15 area during the sharp move lower, a level that represents the 61.8% retracement of the 8419.95 – 8059.22 range. The pair had been relatively muted following the pair’s spike higher to the 8826.00 level on 11 October, a move that saw Stops elected above the 8692.32 area, representing the 76.4% retracement of the move from 8995.00 to 7712.45. Thereafter, the market receded to the 8226.00 area, deriving technical Support around the 50-bar MA (4-hourly).
Chartists are curious to see how market activity behaves around the 8263.50 area, representing the 50% retracement of the move from 7701.00 to 8826.00. Above that level, the 8396.25 area represents the 38.2% retracement of the same range and will also be scrutinised. Below that level, the 8130.75 area represents the 61.8% retracement of the same range, while the 7966.50 area represents the 76.4% retracements of the same range. The 100-bar MA (hourly) recently crossed above the 50-bar MA (hourly), a possible bearish technical development.
Price activity is nearest the 50-bar MA (4-hourly) at 8,280.57 and the 200-bar MA (Hourly) at 8,273.50.
Technical Support is expected around 7,712.45/ 7,508.77/ 7,223.25 with Stops expected below.
Technical Resistance is expected around 9,071.00/ 9,651.00/ 9938.16 with Stops expected above.
On 4-Hourly chart, SlowK is Bearishly below SlowD while MACD is Bearishly below MACDAverage.
On 60-minute chart, SlowK is Bullishly above SlowD while MACD is Bearishly below MACDAverage.
Ethereum
Ethereum (ETH/USD) gained ground early in today’s Asian session after the pair depreciated from the 184.75 area during yesterday’s North American session, trading as low as the 178.63 area. Following the pair’s recent spike higher to the 197.93 area, technical Support had earlier emerged during a pullback lower around the 177.27 area, right around the 100-bar MA (4-hourly). The market has since traded above the 100-bar MA (4-hourly), and continues to closely trade around the 50-bar MA (4-hourly). Additionally, the 50-bar MA (hourly) and 200-bar MA (hourly) have largely converged, an indication of the lack of a clear short-term bias for the pair.
Above current market activity, the 187.12 area represents the 23.6% retracement of the move from 152.11 to 197.93. Below current market activity, the 180.43 level and the 175.02 level represent the 38.2% and 50% retracements of the same range, and the 169.61 area represents the 61.8% retracement of the same range as well. Another indication of the pair’s lack of a clear direction is the fact that it is trading between the 200-bar MA (4-hourly) and 100-bar MA (4-hourly). Chartists are closely scrutinising price activity around the 180.43 area.
Price activity is nearest the 50-bar MA (4-hourly) at 182.17 and the 200-bar MA (Hourly) at 182.10.
Technical Support is expected around 176.40/ 170.95/ 165.01 with Stops expected below.
Technical Resistance is expected around 197.93/ 202.38/ 206.29 with Stops expected above.
On 4-Hourly chart, SlowK is Bullishly above SlowD while MACD is Bearishly below MACDAverage.
On 60-minute chart, SlowK is Bullishly above SlowD while MACD is Bearishly below MACDAverage.


Leave A Comment