
Bitcoin
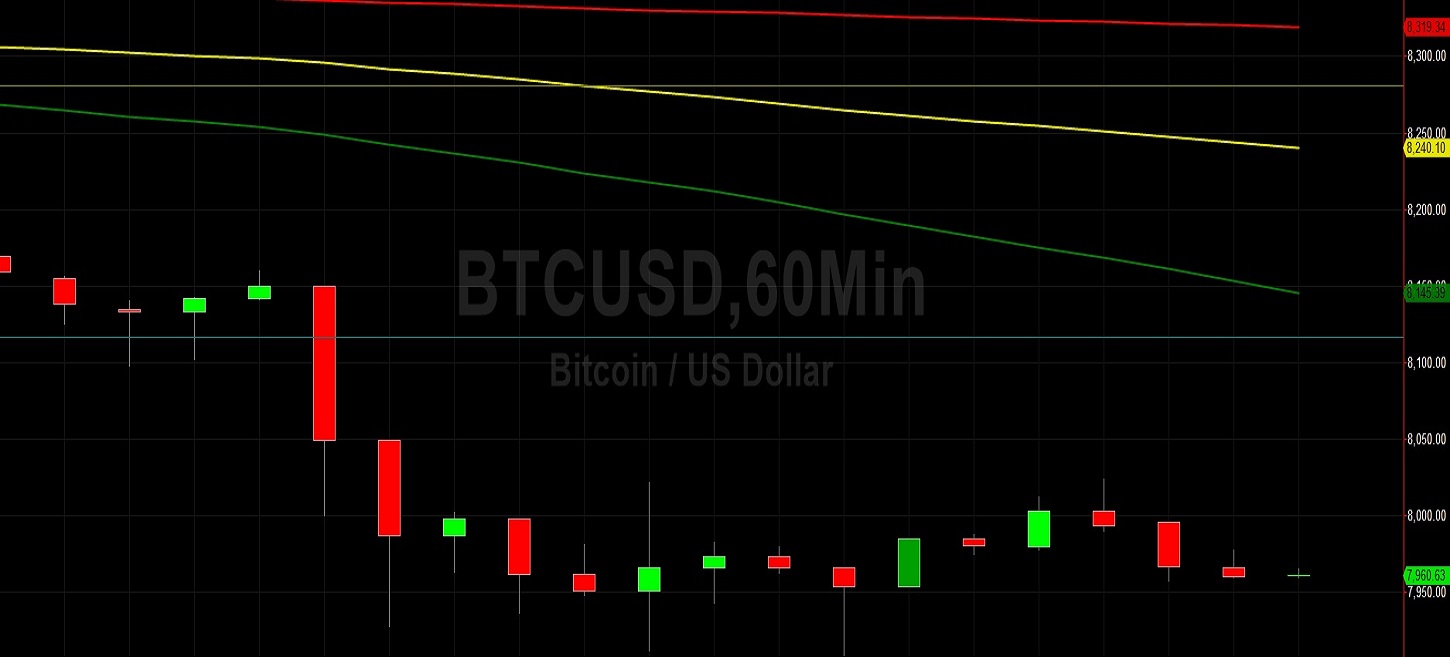
Bitcoin (BTC/USD) was generally weaker early in today’s Asian session as the pair traded as low as the 7957.55 area after trading as low as the 7098.86 area during yesterday’s European session. The pair depreciated sharply from the 8171.50 area during yesterday’s European session as BTC Bears finally found the conviction to push the pair below the 8130.75 area, representing the 61.8% retracement of the 7701.00 – 8826.00 range. BTC/USD continues to trade below its 50-bar MA (hourly), 100-bar MA (hourly), and 200-bar MA (hourly).
Stops were elected below the 7966.50 area during the pair’s move lower, representing the 76.4% retracement of the same range, and the pair then orbited this level during yesterday’s North American session. Stops were also triggered below the 100-bar MA (4-hourly) around the 8246.85 area yesterday. Chartists are observing that there does not appear to be too much buying pressure between current levels and the recent lows around the 7701 area that have been tested three times since 26 September.
Price activity is nearest the 100-bar MA (4-hourly) at 8,250.56 and the 50-bar MA (Hourly) at 8,153.62.
Technical Support is expected around 7,712.45/ 7,508.77/ 7,223.25 with Stops expected below.
Technical Resistance is expected around 8560.50 /9,071.00/ 9,651.00 with Stops expected above.
On 4-Hourly chart, SlowK is Bullishly above SlowD while MACD is Bearishly below MACDAverage.
On 60-minute chart, SlowK is Bullishly above SlowD while MACD is Bullishly above MACDAverage.
Ethereum
Ethereum (ETH/USD) was weaker early in today’s Asian sessios as the pair traded as low as the 173.46 area after trading as low as the 171.70 area during yesterday’s North American session, its weakest print since 7 October. Stops were elected below the 175.04 area during the pair’s move lower, representing the 50% retracement of the move from 152.11 to 197.97. Some Stops were also triggered below the 172.72 area during the move lower, a level that represents the 23.6% retracement of the 239.45 – 152.11 range.
ETH/USD is now trading well below its 50-bar MA (4-hourly), 100-bar MA (4-hourly), and 200-bar MA (4-hourly). Similarly, ETH/USD is now trading well below its 50-bar MA (hourly), 100-bar MA (hourly), and 200-bar MA (hourly). These downward moves evidence the pair’s current downward bias and weaker market sentiment. Notable downside price levels include the 169.63, 165.25, and 162.93 areas, with some ETH/USD Bears also focusing on the 157.39 area ahead of the recent 152.11 low.
Price activity is nearest the 100-bar MA (4-hourly) at 180.18 and the 50-bar MA (Hourly) at 179.43.
Technical Support is expected around 169.24/ 165.25/ 162.93 with Stops expected below.
Technical Resistance is expected around 179.84/ 183.33/ 187.15 with Stops expected above.
On 4-Hourly chart, SlowK is Bullishly above SlowD while MACD is Bearishly below MACDAverage.
On 60-minute chart, SlowK is Bearishly below SlowD while MACD is Bullishly above MACDAverage.
Source link