
Bitcoin
Bitcoin (BTC/USD) showed some signs of weakness during today’s Asian session as traders drove the pair back around the 7764.19 level, representing the 38.2% retracement of the recent move from 6755.00 to 8388.00. Late in yesterday’s North American session, the pair fell below the 7709.26 area, representing the 23.6% retracement of the 5512.00 – 8388.00 range. Another key level that traders are watching is 7598.36, representing the 61.8% retracement of the absolutely lifetime range of BTC/USD.
Notably, the pair is now trading below its 50-bar MA (hourly) which is now around 8007.14 and has just moved below its 100-bar MA (hourly), now around the 7852.96 area. After peaking around the 8388.00 level on 16 May, the pair has consolidated and chartists are now focusing on areas of technical Support. Further selling pressure may open up the 7402.50 area, representing a relative high dating to September 2018. Also, the 7223.25 area may also be back in focus, representing the 76.4% retracement of the 8488.00 – 3128.89 level.
Price activity is nearest the 50-bar MA (4-hourly) at 7219.60 and the 100-bar MA (Hourly) at 7852.62.
Technical Support is expected around 7170.09/ 6853.50/ 6440.82 with Stops expected below.
Technical Resistance is expected around 8488.00/ 9734.52/ 9948.12 with Stops expected above.
On 4-Hourly chart, SlowK is Bearishly below SlowD while MACD is Bearishly below MACDAverage.
On 60-minute chart, SlowK is Bearishly below SlowD while MACD is Bearishly below MACDAverage.
Ethereum
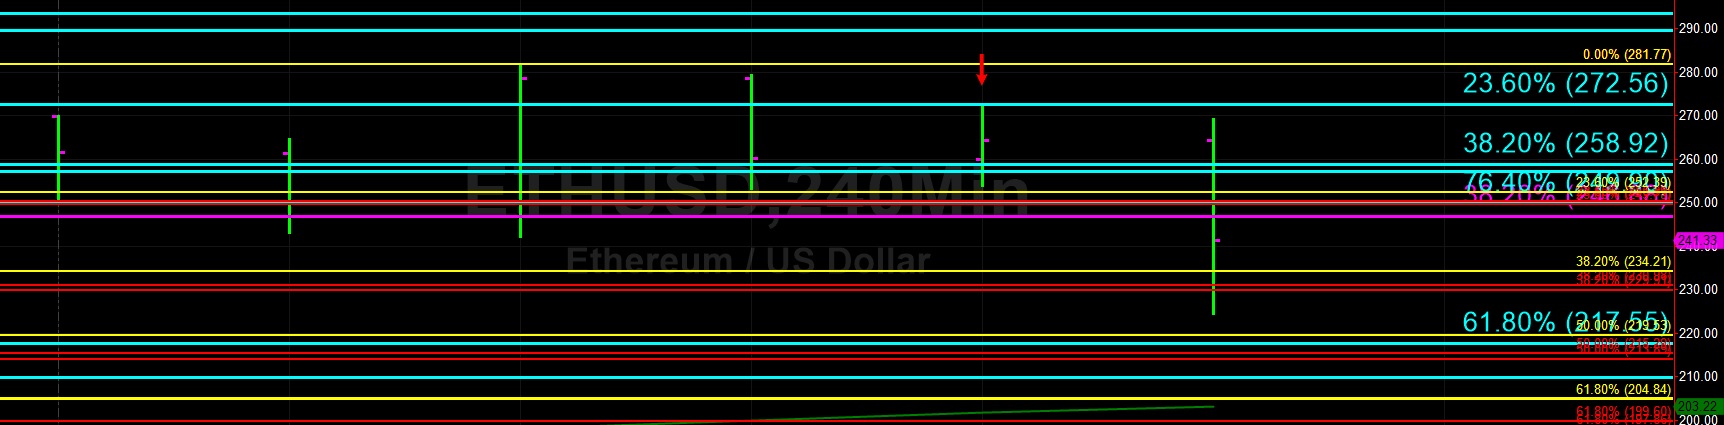
Ethereum (ETH/USD) depreciated early in today’s Asian session, moving back below the 248.88 level, representing the 38.2% retracement of the 515.88 – 80.60 range. Chartists noted a very bearish clue late in yesterday’s North American session when the pair ran out of steam right on its move higher right around the 272.56 area, representing the 23.6% retracement of the move from 894.00 to 80.60. The pair’s recent high of 281.77 is its strongest showing since early September 2018. Traders gunned for Stops today below the 234.21 area, representing the 38.2% retracement of the move from 80.60 to 281.77.
Given the current pullback, traders are assessing where areas of technical Support may emerge. The 222.78 area is a previous relative high dating to early November 2018, and price activity around this area will be important. The 228.91 area is another very important area, representing the 38.2% retracement of the move from 146.00 to 281.77. Other notable areas of technical Support include 217.55 and 204.84. The 100-bar MA (hourly) is also right around current price activity.
Price activity is nearest the 50-bar MA (4-hourly) at 202.95 and the 100-bar MA (Hourly) at 225.28.
Technical Support is expected around 204.84/ 185.46/ 175.10 with Stops expected below.
Technical Resistance is expected around 281.77/ 302.20/ 314.00 with Stops expected above.
On 4-Hourly chart, SlowK is Bearishly below SlowD while MACD is Bearishly below MACDAverage.
On 60-minute chart, SlowK is Bearishly below SlowD while MACD is Bearishly below MACDAverage.


Leave A Comment