
Bitcoin
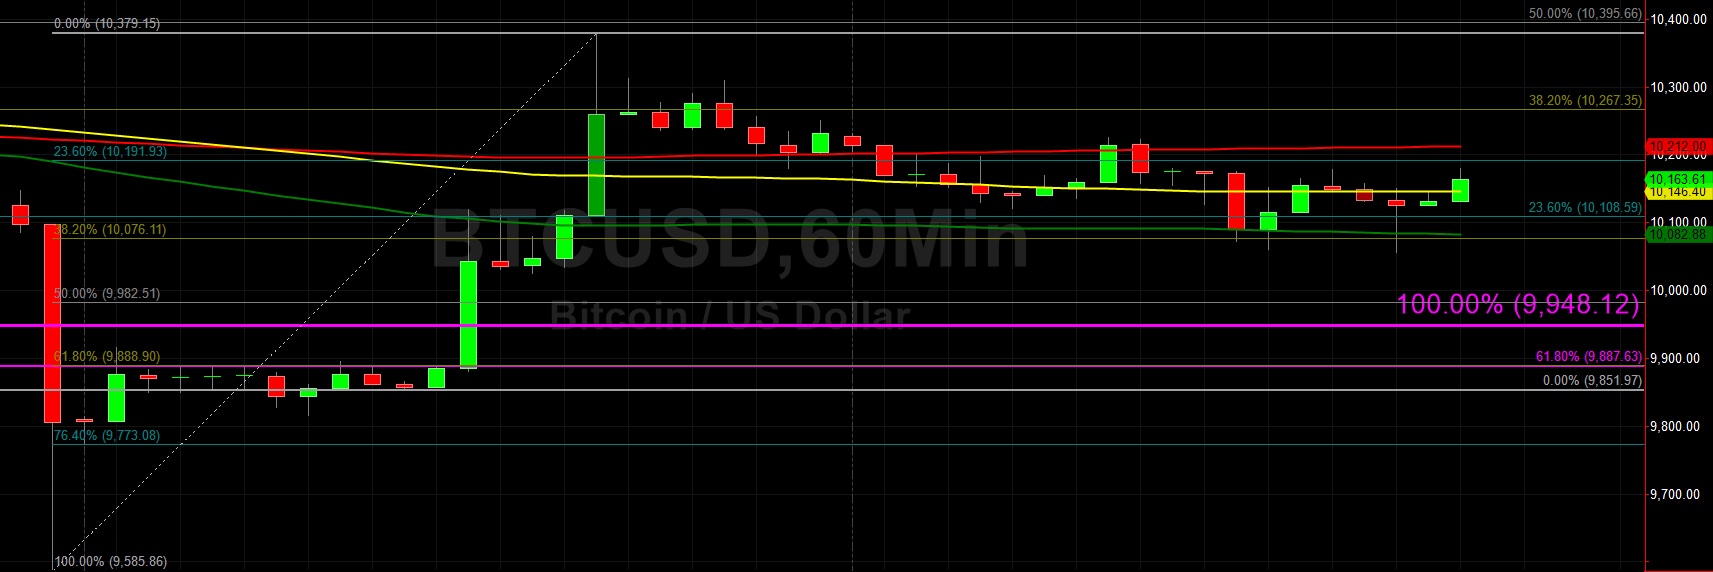
Bitcoin (BTC/USD) drifted lower early in today’s Asian session as the pair traded as low as the 10056.30 following steady selling pressure that emerged during yesterday’s Asian session when the pair ran out of steam around the 10379.15 level. Bids emerged early today right around the 23.6% retracement of the 13202.63 – 9071.00 range following steady selling pressure during yesterday’s European and North American sessions. BTC/USD is again trading below its 50-bar MA (4-hourly), 100-bar MA (4-hourly), and 200-bar MA (4-hourly).
Stops were elected below the 10076.11 area late in yesterday’s North American session, representing the 38.2% retracement of the recent 9585.86 – 10379.15 range. Below current market levels, chartists are observing possible technical Support around the 9982, 9888, and 9773 levels with a lot of renewed focus on the 9765.93 area, representing the 38.2% retracement of the 3128.89 – 13868.44 range. Below that area, traders are paying very close attention to the 9532.39 area.
Price activity is nearest the 50-bar MA (4-hourly) at 10,211.30 and the 100-bar MA (Hourly) at 10,146.38.
Technical Support is expected around 9,765.93/ 9,532.39/ 9,265.49 with Stops expected below.
Technical Resistance is expected around 10,833.14/ 11,136.82/ 11,759.72 with Stops expected above.
On 4-Hourly chart, SlowK is Bullishly above SlowD while MACD is Bullishly above MACDAverage.
On 60-minute chart, SlowK is Bullishly above SlowD while MACD is Bearishly below MACDAverage.
Ethereum
Ethereum (ETH/USD) extended its recent selloff early in today’s Asian session as the pair traded as low as the 212.00 area late in yesterday’s North American session, briefly recovered, and then faded to the 213.77 area. The 212.85 area has emerged as an important level, representing the 50% retracement of the move from 200.98 to 224.71. Below current market activity, traders are paying close attention to levels including 210.04 and 206.58.
ETH/USD continues to trade above its 50-bar MA (4-hourly), 100-bar MA (4-hourly), and 200-bar MA (4-hourly). Also, the pair has recently tested its 50-bar MA (hourly) but is at risk of moving below this area in the near-term, currently indicating around the 214.23 area. Chartists are also paying close attention to the 213.84 area and the 209.75 area on the downside with the 201.38 as an important downside price objective that represents the 50% retracement of the 322.16 – 80.60 range.
Price activity is nearest the 50-bar MA (4-hourly) at 197.24 and the 50-bar MA (Hourly) at 214.23.
Technical Support is expected around 197.56/ 191.40/ 188.38 with Stops expected below.
Technical Resistance is expected around 226.56/ 229.88/ 236.43 with Stops expected above.
On 4-Hourly chart, SlowK is Bearishly below SlowD while MACD is Bearishly below MACDAverage.
On 60-minute chart, SlowK is Bearishly below SlowD while MACD is Bearishly below MACDAverage.


Leave A Comment