
Bitcoin
Bitcoin (BTC/USD) erased some of yesterday’s steady losses early in today’s Asian session as the pair climbed to the 10,654.94 area, right around the 23.6% retracement of the move from 13,868.44 to 9,651.00. The next upside levels related to that range include 11,262.06 and 11,759.72. During yesterday’s Asian session, the pair tested the 11,091.90 level but was then unable to move above the 100-bar MA (4-hourly). The pair then moved lower during yesterday’s European and North American sessions before finding an early Bid today.
BTC/USD briefly traded below the 50-bar MA (4-hourly) during yesterday’s North American session before moving back above. Chartists are deliberating the pair’s next moves. Above current market activity, BTC/USD is nearing an encounter with the 200-bar MA (4-hourly) and the 100-bar MA (4-hourly), which are converging with one another. Other notable upside levels include the 11,394.08 and the 11,978.03 areas. Below current market activity, some relevant levels include 9,948.12 and 9,765.93.
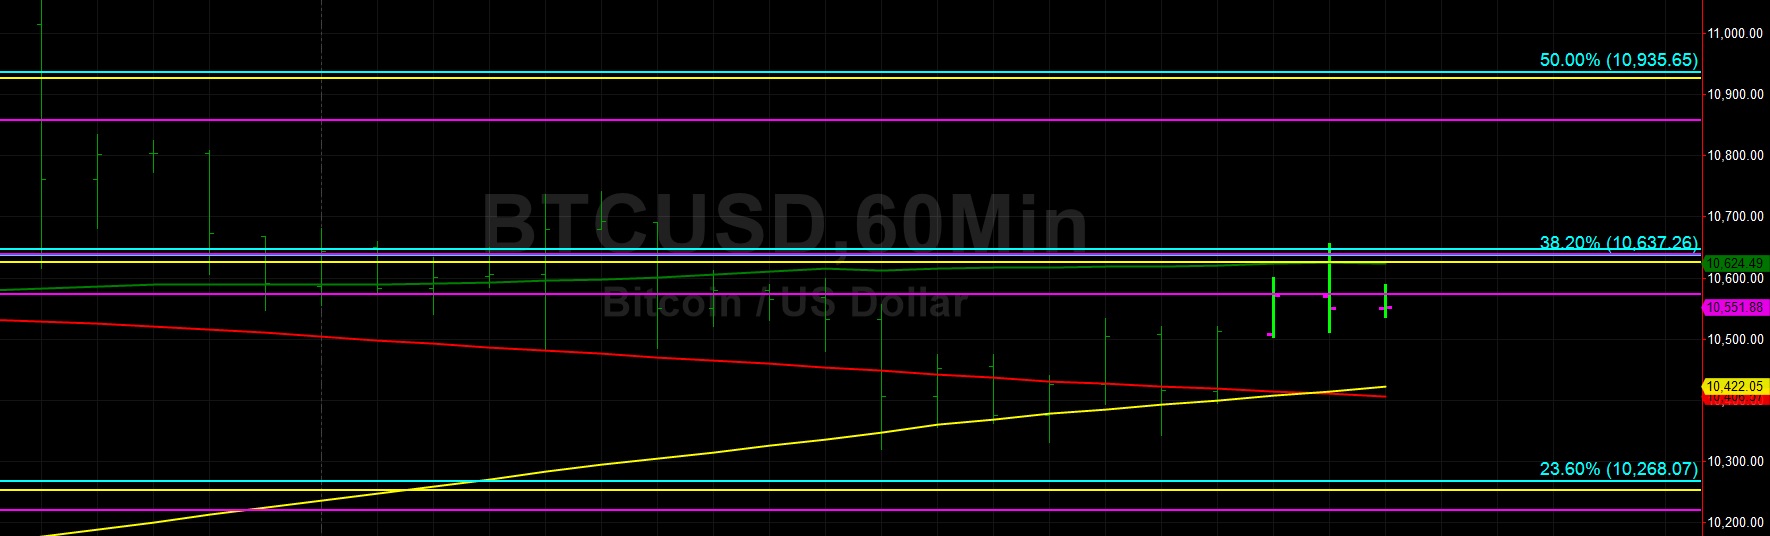
Price activity is nearest the 50-bar MA (4-hourly) at 10,406.14 and the 50-bar MA (Hourly) at 10,624.65.
Technical Support is expected around 10,268.07/ 10,046.06/ 9,532.39 with Stops expected below.
Technical Resistance is expected around 11,202.00/ 11,510.44/ 12,227.57 with Stops expected above.
On 4-Hourly chart, SlowK is Bearishly below SlowD while MACD is Bearishly below MACDAverage.
On 60-minute chart, SlowK is Bullishly above SlowD while MACD is Bullishly above MACDAverage.
Ethereum
Ethereum (ETH/USD) gained back some lost ground early in today’s Asian session as the pair moved back to the 226.77 area after trading as low as the 217.04 area during yesterday’s North American session. The pair traded as high as the 236.58 area late in Saturday’s North American session and had steadily declined since that area, also representing the 61.8% retracement of the move from 157.28 to 364.49. The next upside level related to this range is the 260.89 area.
ETH/USD continues to orbit its 50-bar MA (4-hourly), and again tested this area early in today’s Asian session. Chartists continue to cite some technical Resistance around the 235 – 236 areas and then the 249.90 area comes back into view, representing the 76.4% retracement of the move from 302.20 to 80.60. Above that area, there are some important levels between the 256 and 259 areas, including the 257.22 level that represents the 23.6% retracement of the move from 828.97 to 80.60.
Price activity is nearest the 50-bar MA (4-hourly) at 225.44 and the 50-bar MA (Hourly) at 225.49.
Technical Support is expected around 217.55/ 206.18/ 191.40 with Stops expected below.
Technical Resistance is expected around 242.85/ 257.22/ 265.15 with Stops expected above.
On 4-Hourly chart, SlowK is Bearishly below SlowD while MACD is Bullishly above MACDAverage.
On 60-minute chart, SlowK is Bullishly above SlowD while MACD is Bullishly above MACDAverage.


![BAD BUNNY – LUNA (feat. ROSALÍA) [Music Video]](https://areyoupop.com/wp-content/uploads/1785686035_maxresdefault-500x383.jpg)
Leave A Comment