
Litecoin
Litecoin (LTC/USD) attempted to find relief from recent massive selling pressure below the psychologically-important 100.00 figure early in today’s Asian session. The pair’s depreciation during the month of August has been relatively abrupt from its recent high of 107.04 from 5 August. Notably, the 106.62 area represented the 23.6% retracement of the move from 380.00 to 22.17, and LTC/USD Bulls were unable to make a sustainable move above this level.
Sentiment has recently been extremely Bearish given the pair’s ongoing depreciation below the 50-bar MA (4-hourly), which is now trading below the 100-bar MA (4-hourly) and 200-bar MA (4-hourly). The market’s negative bias intensified after traders made a decisive break below the 83.36 area this month, representing the 38.2% retracement of the move from 182.35 to 22.17. Market activity has hugged the 75.06 area in recent trading sessions, representing the 50% retracement of the move from 127.95 to 22.17. Below current market activity, the 63.99 level remains an important downside target.
Price activity is nearest the 50-bar MA (4-hourly) at 77.66 and the 100-bar MA (Hourly) at 75.30.
Technical Support is expected around 69.47/ 63.99/ 44.65 with Stops expected below.
Technical Resistance is expected around 83.34/ 95.86/ 99.10 with Stops expected above.
On 4-Hourly chart, SlowK is Bearishly below SlowD while MACD is Bullishly above MACDAverage.
On 60-minute chart, SlowK is Bullishly above SlowD while MACD is Bullishly above MACDAverage.
Bitcoin Cash
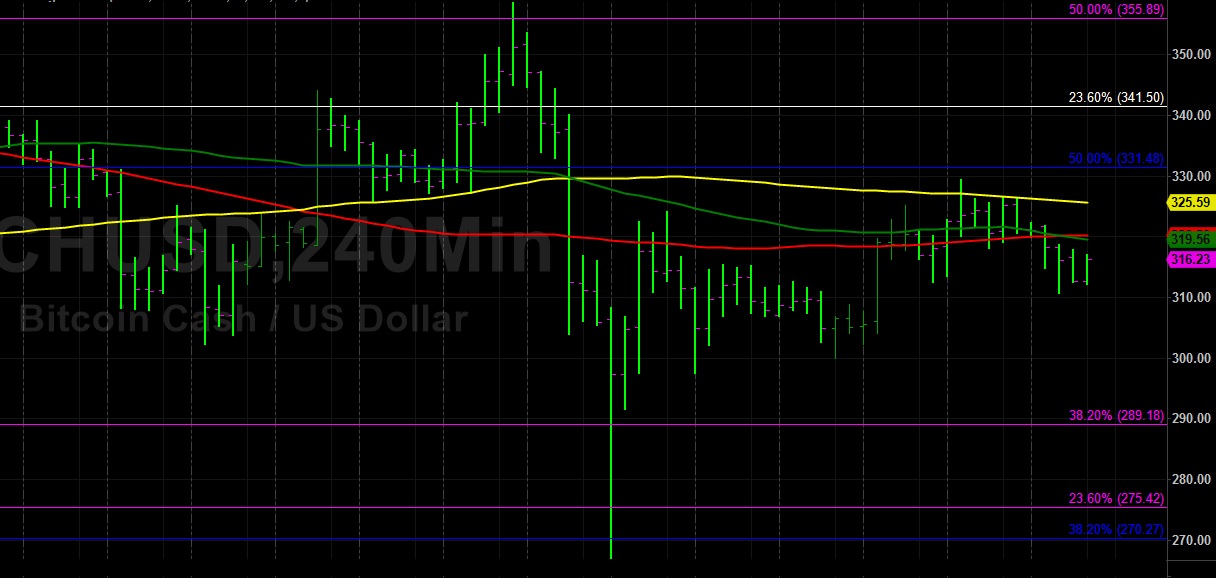
Bitcoin Cash (BCH/USD) continued to trade around the psychologically-important 300.00 figure early in today’s Asian session as traders searched for market sentiment following the pair’s recent relatively tight range. The pair depreciated sharply from the 358.58 level on 13 August after traders failed to make a sustainable break above the 355.89 area, representing the 50% retracement of the move from 638.55 to 73.22. Bids quickly emerged around the 270.27 area, representing the 38.2% retracement of the move from 590.81 to 72.15.
Market sentiment in the short-term is unknown and one indication of this is the recent convergence of the 50-bar MA (4-hourly), 100-bar MA (4-hourly), and 200-bar MA (4-hourly). Additionally, the 50-bar MA (hourly), 100-bar MA (hourly), and 200-bar MA (hourly) have converged, an additional indication that market bias remains uncertain. Above market activity, traders are closely watching the 321 and 341 levels, and below market activity, traders are closely watching the 289 and 275 levels.
Price activity is nearest the 50-bar MA (4-hourly) at 319.57 and the 100-bar MA (Hourly) at 314.96.
Technical Support is expected around 275.42/ 262.40/ 237.83 with Stops expected below.
Technical Resistance is expected around 323.01/ 331.64/ 344.09 with Stops expected above.
On 4-Hourly chart, SlowK is Bearishly below SlowD while MACD is Bearishly below MACDAverage.
On 60-minute chart, SlowK is Bullishly above SlowD while MACD is Bearishly below MACDAverage.
Source link