
Litecoin
Litecoin (LTC/USD) sought fresh market direction early in today’s Asian session as the pair continues to trade below the psychologically-important 100.00 figure, a level it fell sharply below earlier this month. The market yielded a lot of clues during its descent below this area, especially around the 83.34 area, a downside price objective related to the recent high of 145.97. Likewise, LTC/USD Bulls have managed to keep the pair Bid above the 68.44 area, representing the 61.8% retracement of the move from 22.17 to 144.34.
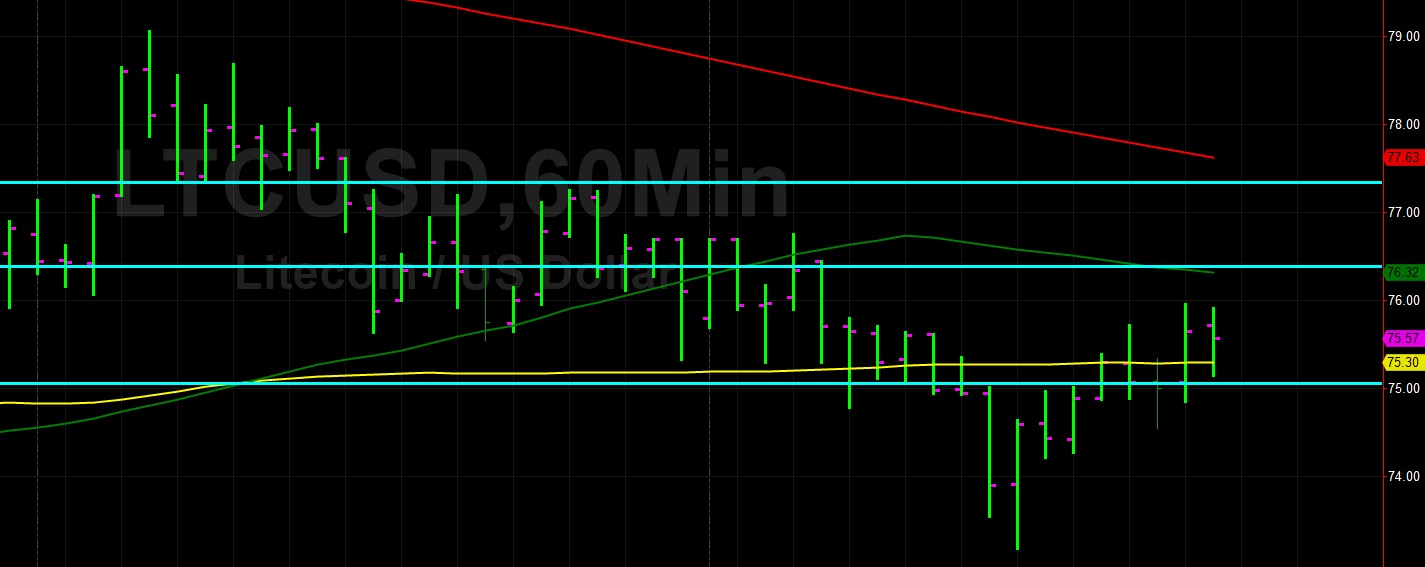
Sentiment clearly remains quite Bearish given the pair’s ongoing depreciation below the 50-bar MA (4-hourly), which is now trading below the 100-bar MA (4-hourly) and 200-bar MA (4-hourly). The market’s negative bias recently intensified after traders made a decisive break below the 83.36 area this month. Market activity has orbited the 75.06 area in recent trading sessions, representing the 50% retracement of the move from 127.95 to 22.17. Below current market activity, the 63.99 level remains an important downside target.
Price activity is nearest the 50-bar MA (4-hourly) at 77.66 and the 100-bar MA (Hourly) at 75.30.
Technical Support is expected around 69.47/ 63.99/ 44.65 with Stops expected below.
Technical Resistance is expected around 83.34/ 95.86/ 99.10 with Stops expected above.
On 4-Hourly chart, SlowK is Bearishly below SlowD while MACD is Bullishly above MACDAverage.
On 60-minute chart, SlowK is Bullishly above SlowD while MACD is Bullishly above MACDAverage.
Bitcoin Cash
Bitcoin Cash (BCH/USD) extended its recent negative market bias early in today’s Asian session as traders searched for some bullish market sentiment following the pair’s recent relatively tight range. The pair depreciated sharply from the 358.58 level on 13 August after traders failed to make a sustainable break above the 355.89 area, representing the 50% retracement of the move from 638.55 to 73.22, and has been relative Bearish since then. Bids quickly emerged around the 270.27 area after that plunge, representing the 38.2% retracement of the move from 590.81 to 72.15.
Market sentiment in the short-term appears to be Bearish and one indication of this is the recent convergence of the 50-bar MA (4-hourly), 100-bar MA (4-hourly), and 200-bar MA (4-hourly). Additionally, the 50-bar MA (hourly), 100-bar MA (hourly), and 200-bar MA (hourly) have converged, an additional indication that market bias remains uncertain. Above market activity, traders are closely watching the 321 and 341 levels, and below market activity, traders are closely watching the 289 and 275 levels.
Price activity is nearest the 50-bar MA (4-hourly) at 319.57 and the 100-bar MA (Hourly) at 314.96.
Technical Support is expected around 275.42/ 262.40/ 237.83 with Stops expected below.
Technical Resistance is expected around 323.01/ 331.64/ 344.09 with Stops expected above.
On 4-Hourly chart, SlowK is Bearishly below SlowD while MACD is Bearishly below MACDAverage.
On 60-minute chart, SlowK is Bullishly above SlowD while MACD is Bearishly below MACDAverage.


Leave A Comment