
Bitcoin
Bitcoin (BTC/USD) continued to consolidate recent gains early in today’s Asian session as the pair traded back below the psychologically-important 10,000 figure following its recent move to a relative high of 10,478.00. Stops were elected below the 10,033.66 area during the move lower, representing the 61.8% retracement of the move from 9,759 to 10,478. Bids emerged around the 9,880.59 area, representing the 61.8% retracement of the move from 7,427 to 13,850.
BTC/USD Bears also triggered Stops below the 10,218.54 area during the pullback, the area where the 50-bar MA (hourly) was then indicating. The pair’s short-term outlook and bias again looks weak, and chartists are again considering some downside price objectives. The 9,285 and 9,071 levels are potential areas of technical Support, as well as the 8,203.91 level, representing the 61.8% retracement of the move from 4,702.53 to 13,868.44.
Price activity is nearest the 50-bar MA (4-hourly) at 10,340.16 and the 50-bar MA (Hourly) at 10,218.40.
Technical Support is expected around 9,765.93/ 9,265.49/ 8,919.72 with Stops expected below.
Technical Resistance is expected around 10,367.06/ 10,508.20/ 11,136.82 with Stops expected above.
On 4-Hourly chart, SlowK is Bearishly below SlowD while MACD is Bearishly below MACDAverage.
On 60-minute chart, SlowK is Bearishly below SlowD while MACD is Bearishly below MACDAverage.
Ethereum
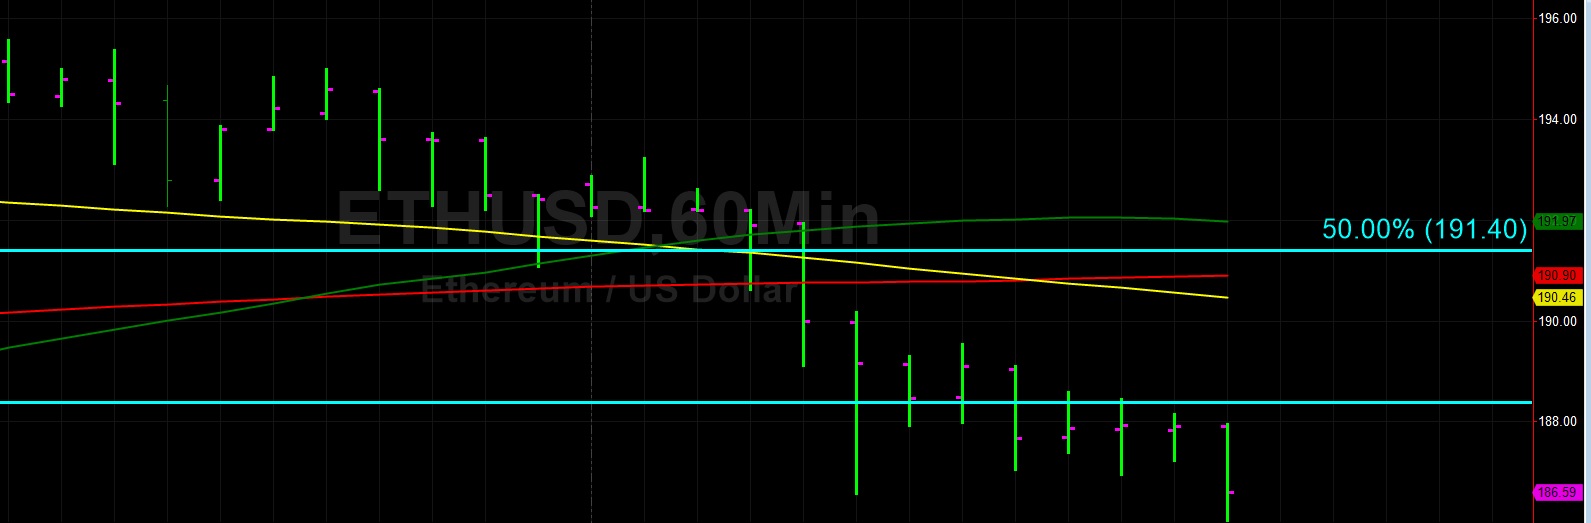
Ethereum (ETH/USD) slumped lower early in today’s Asian session as the pair continued to move away from the psychologically-important 200.00 figure following its recent test of the 196.66 area. The pair briefly traded above the 196.15 level, representing the 76.4% retracement of the move from 144.15 to 364.49. Bids emerged during ETH/USD’s pullback around the 186.36 area, representing the 61.8% retracement of the move from 180.00 to 196.66.
Above current market activity, the 50-bar MA (4-hourly) once again represents technical Resistance, and chartists are looking to see if the pair will remain Given above the 190.98 level. The 200-bar MA (hourly) has just crossed above the 100-bar MA (hourly), a Bearish development that could lead to additional selling pressure. Traders are focusing on a couple of important short-term downside price targets, including the 183 and 178 levels.
Price activity is nearest the 50-bar MA (4-hourly) at 191.06 and the 100-bar MA (Hourly) at 190.47.
Technical Support is expected around 183.93/ 181.84/ 178.47 with Stops expected below.
Technical Resistance is expected around 206.18/ 209.75/ 217.55 with Stops expected above.
On 4-Hourly chart, SlowK is Bearishly below SlowD while MACD is Bearishly below MACDAverage.
On 60-minute chart, SlowK is Bearishly below SlowD while MACD is Bearishly below MACDAverage.


Leave A Comment