
Bitcoin
Bitcoin (BTC/USD) made some moves higher early in today’s Asian session and traded as high as the 8737.00 area after Bids emerged around the 8662.25 area. During yesterday’s North American session, BTC/USD moved sharply lower in short order as Stops were elected below the 8598.42 area, representing the 23.6% retracement of the move from 7467.10 to 8947.88. Momentum accounts got involved in the quick move downward when they saw relative highs of 8710 and 8695 give way during brief retracements higher and many shorts were covered around the 8546 area, a short-term intraday price objective that has held.
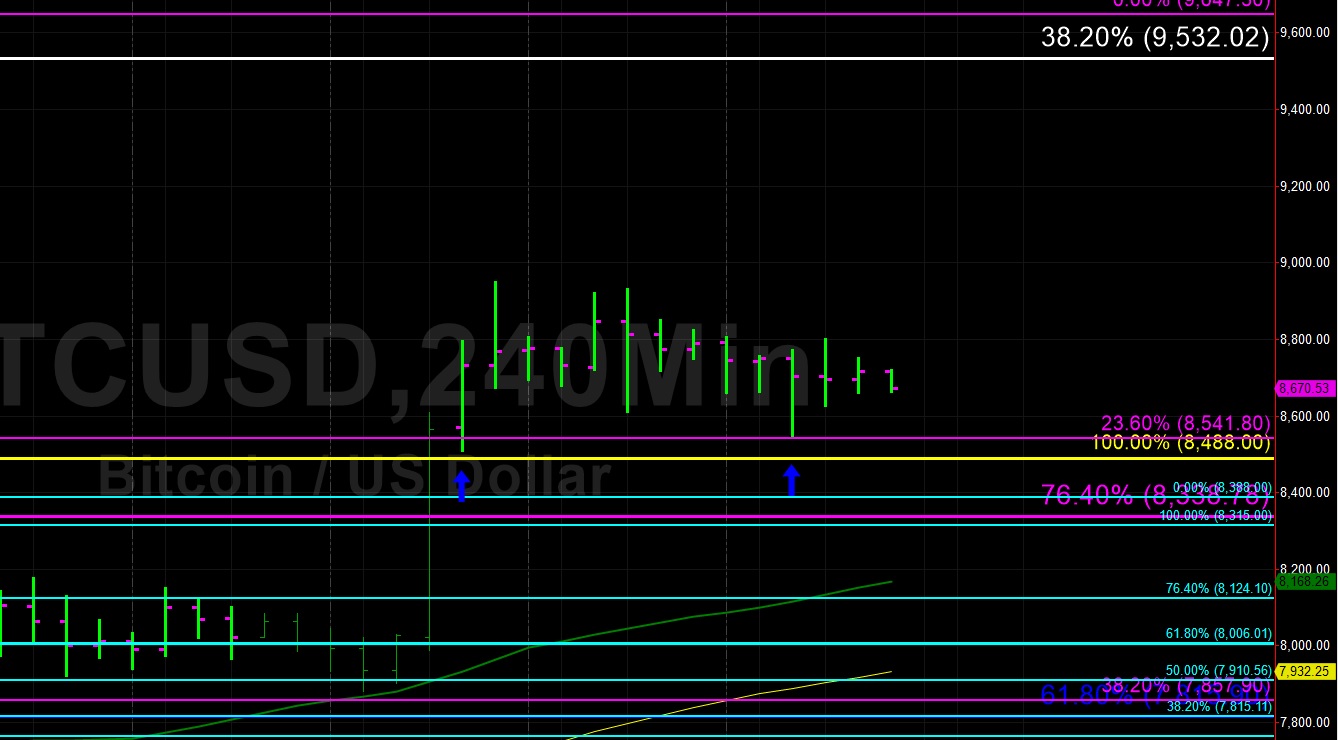
Above current price activity, the market will need to clear the 8793.98 and 8852.80 areas before working to establish fresh multi-month highs, representing retracement levels related to the 8947.88 – 8545.00 range. If those prices can be tested, the 9532.39 level continues to be a very important upside price level, representing the 38.2% retracement of the move from 19891.99 to 3128.89. Above that area, the 9948.12 level is a relative historical high that could provide some technical Resistance. The market is currently trading below the 50-bar MA (hourly).
Price activity is nearest the 50-bar MA (4-hourly) at 8168.71 and the 50-bar MA (Hourly) at 8751.87.
Technical Support is expected around 8488.00/ 8124.10/ 7506.12 with Stops expected below.
Technical Resistance is expected around 9532.02/ 9948.12/ 10121.50 with Stops expected above.
On 4-Hourly chart, SlowK is Bearishly below SlowD while MACD is Bearishly below MACDAverage.
On 60-minute chart, SlowK is Bearishly below SlowD while MACD is Bearishly below MACDAverage.
Ethereum
Ethereum (ETH/USD) showed a downward bias early in today’s Asian session, depreciating to the 267.55 area after Stops were triggered below the 268.12 area, representing the 23.6% retracement of the move from 281.77 to 222.88. During yesterday’s North American session, the market was capped around the 276.50 area, representing the 76.4% retracement of the move from 279.55 to 265.45. If the selling pressure persists during today’s price activity, the 266.60 area could be challenged, representing the 38.2% retracement of the move from 245.66 to 279.55.
Below current price activity, there are multiple levels of potential technical Support between 253 – 261. The 259.27 area represents the 61.8% retracement of the move from 281.77 to 222.88 and will be closely watched. Additionally, the 257.22 area represents the 23.6% retracement of the 828.97 – 80.60 range and is a very important level. Chartists are also eyeing the 252.39 area, representing the 23.6% retracement of the move from 157.28 to 281.77.
Price activity is nearest the 50-bar MA (4-hourly) at 255.74 and the 50-bar MA (Hourly) at 269.85.
Technical Support is expected around 260.73/ 243.82/ 231.12 with Stops expected below.
Technical Resistance is expected around 281.77/ 289.64/ 298.24 with Stops expected above.
On 4-Hourly chart, SlowK is Bearishly below SlowD while MACD is Bearishly below MACDAverage.
On 60-minute chart, SlowK is Bearishly below SlowD while MACD is Bearishly below MACDAverage.


Leave A Comment