
Bitcoin
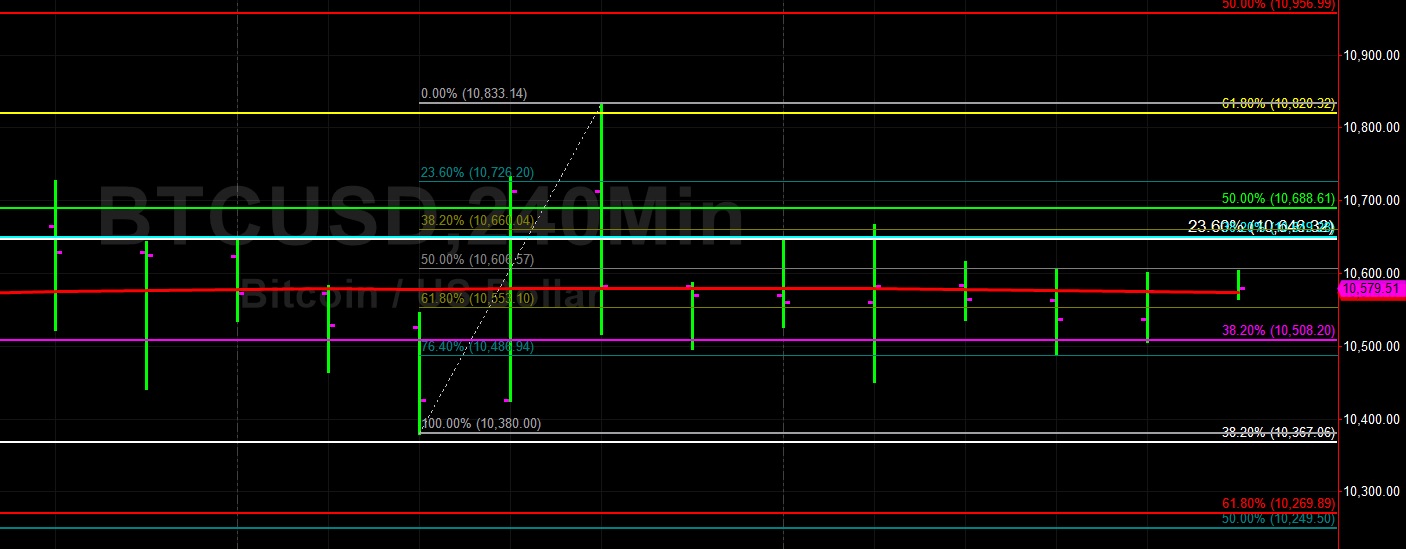
Bitcoin (BTC/USD) gained a little bit of ground early in today’s Asian session as the pair traded as high as the 10602.10 area after finding Bids around the 10488.99 area during yesterday’s North American session. Today’s Bids early in the Asian session are right around the 200-bar MA (4-hourly) and traders are waiting to see if the pair can establish a constructive base around that area. Also, Bids emerged at the 10507.07 area late in yesterday’s North American session, a Bullish development because it is right around the 38.2% retracement of the 5072.01 – 13868.44 range.
There has been some technical Resistance around the 10606.57 area during the past couple of trading sessions, a level that represents the 50% retracement of the move from 10308 to 10833.14. Above current market activity, Offers are expected around the 10660 and 10726 areas, with some Stops likely above. Also, the 10956.99 area is an important one that represents the 50% retracement of the 8045.54 – 13868.44 range. Additional selling pressure is expected around the 11136 and 11333 areas with 11262.06 being another important upside price objective.
Price activity is nearest the 200-bar MA (4-hourly) at 10,574.18 and the 50-bar MA (Hourly) at 10,562.47.
Technical Support is expected around 9,765.93/ 9,532.39/ 9,265.49 with Stops expected below.
Technical Resistance is expected around 10,833.14/ 11,136.82/ 11,759.72 with Stops expected above.
On 4-Hourly chart, SlowK is Bearishly below SlowD while MACD is Bearishly below MACDAverage.
On 60-minute chart, SlowK is Bullishly above SlowD while MACD is Bullishly above MACDAverage.
Ethereum
Ethereum (ETH/USD) moved slightly higher early in today’s Asian session as the pair traded as high as the 175.82 area after finding Bids around the 168.82 area during yesterday’s European session. Bids then emerged around the 171.21 area during yesterday’s North American session and BTC/USD Bulls gained the strength to push the pair above the 50-bar MA (4-hourly). Today’s intraday high of 175.82 is right around the 50% retracement of the 183.15 – 168.82 range.
Above that area, the 177.68 and 179.77 areas represent upside technical Resistance ahead of 183.15. Technicians are also observing some technical Resistance around the 100-bar MA (4-hourly), currently indicating around the 180.75 area. The 183.33 level is another important one, representing the 23.6% retracement of the move from 515.88 to 80.60. Additional selling pressure is expected between the 187 and 189 areas ahead of the 191.40 level, representing the 50% retracement of the move from 302.20 to 80.60.
Price activity is nearest the 50-bar MA (4-hourly) at 172.65 and the 200-bar MA (Hourly) at 172.67.
Technical Support is expected around 167.80/ 165.25/ 157.28 with Stops expected below.
Technical Resistance is expected around 183.33/ 188.38/ 191.40 with Stops expected above.
On 4-Hourly chart, SlowK is Bullishly above SlowD while MACD is Bearishly below MACDAverage.
On 60-minute chart, SlowK is Bearishly below SlowD while MACD is Bullishly above MACDAverage.


Leave A Comment