Bitcoin
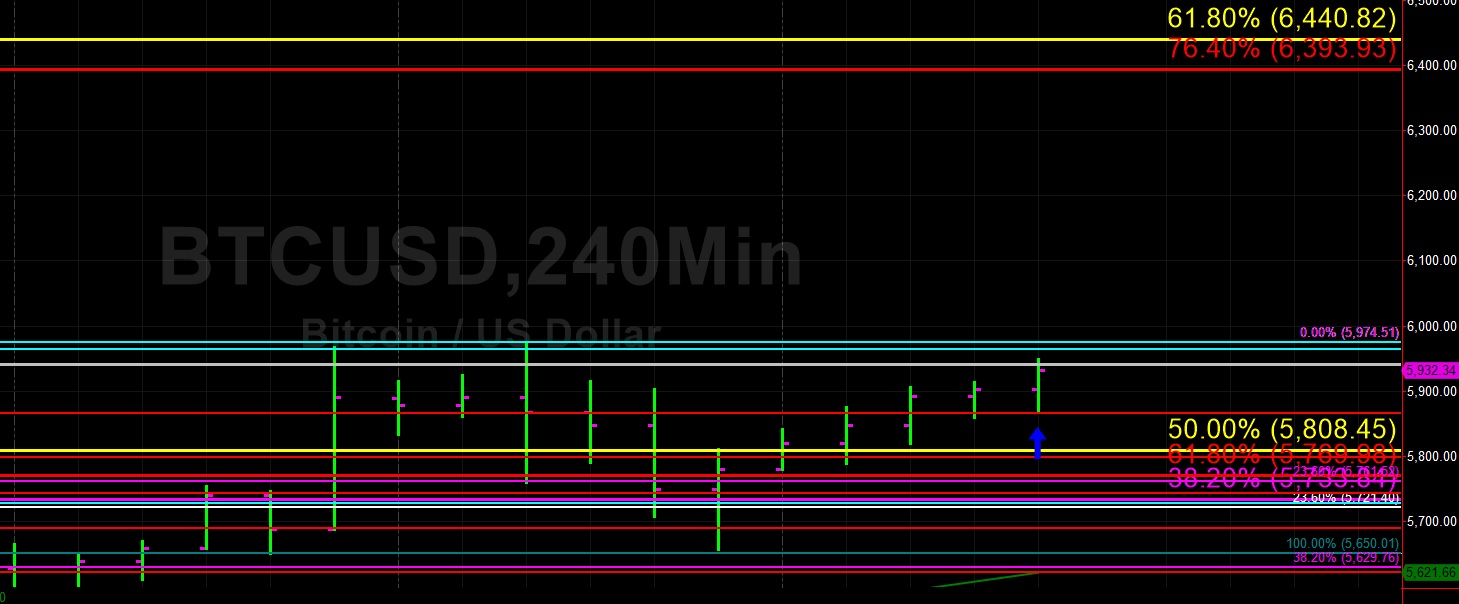
Bitcoin (BTC/USD) extended recent gains during today’s Asian session and is again with striking distance of testing the psychologically-important 6000.00 figure. There have now been several 240-minute bars with higher highs, higher lows, and higher closes, evidence of positive market sentiment. Today’s intraday high is right around the 76.4% retracement of the 6810.00 – 3128.89 range.
Bids emerged around the 5865.36 level during the move higher, representing the 23.6% retracement of the move from 5512.00 to 5974.51. Another indication of positive sentiment relates to the Bids the pair found above the 5650.01 area, a recent relative high. Chartists are deliberating how high BTC/USD could trade if it moves above the 6000.00 area with technicians watching 6393.93/ 6440.82/ 6538.51.
Price activity is nearest the 50-bar MA (4-hourly) at 5621.72 and the 50-bar MA (Hourly) at 5852.22.
Technical Support is expected around 5468.57/ 5234.73/ 5125.13 with Stops expected below.
Technical Resistance is expected around 6393.93/ 6440.82/ 6538.51 with Stops expected above.
On 4-Hourly chart, SlowK is Bullishly above SlowD while MACD is Bullishly above MACDAverage.
On 60-minute chart, SlowK is Bullishly above SlowD while MACD is Bullishly above MACDAverage.
Ethereum
Ethereum (ETH/USD) appreciated early in today’s Asian session as the pair tested Offers around the 171.64 level, right around the 38.2% retracement of the 157.28 – 180.69 area. Some Stops were triggered above the 171.22 area during the move higher, representing the 38.2% retracement of the 155.91 – 180.69 range.
During yesterday’s North American session, Bids emerged around the 166.22 area, representing the 61.8% retracement of the 157.28 – 180.69 range. Chartists are eyeing the 173.55 and 176.28 areas as important upside targets. If the market is able to move above upside congestion, some notable areas of technical Resistance include 183.33/ 189.23/ 191.40 with technicians also eyeing the 201.38 level as an important one.
Price activity is nearest the 200-bar MA (4-hourly) at 165.53 and the 50-bar MA (Hourly) at 171.25.
Technical Support is expected around the 162.36/ 159.25/ 148.81 levels with Stops expected below.
Technical Resistance is expected around the 177.80/ 183.33/ 187.62 levels with Stops expected above.
On 4-Hourly chart, SlowK is Bearishly below SlowD while MACD is Bearishly below MACDAverage.
On 60-minute chart, SlowK is Bullishly above SlowD while MACD is Bullishly above MACDAverage.


Leave A Comment