
XRP has been steadily falling in value since late-June 2019. Valued at $0.24561 at press time, XRP had a market cap of $10.95 billion and a 24h trading volume of $1.24 billion, recording a 0.20% fall over the past day.
XRP Daily Chart
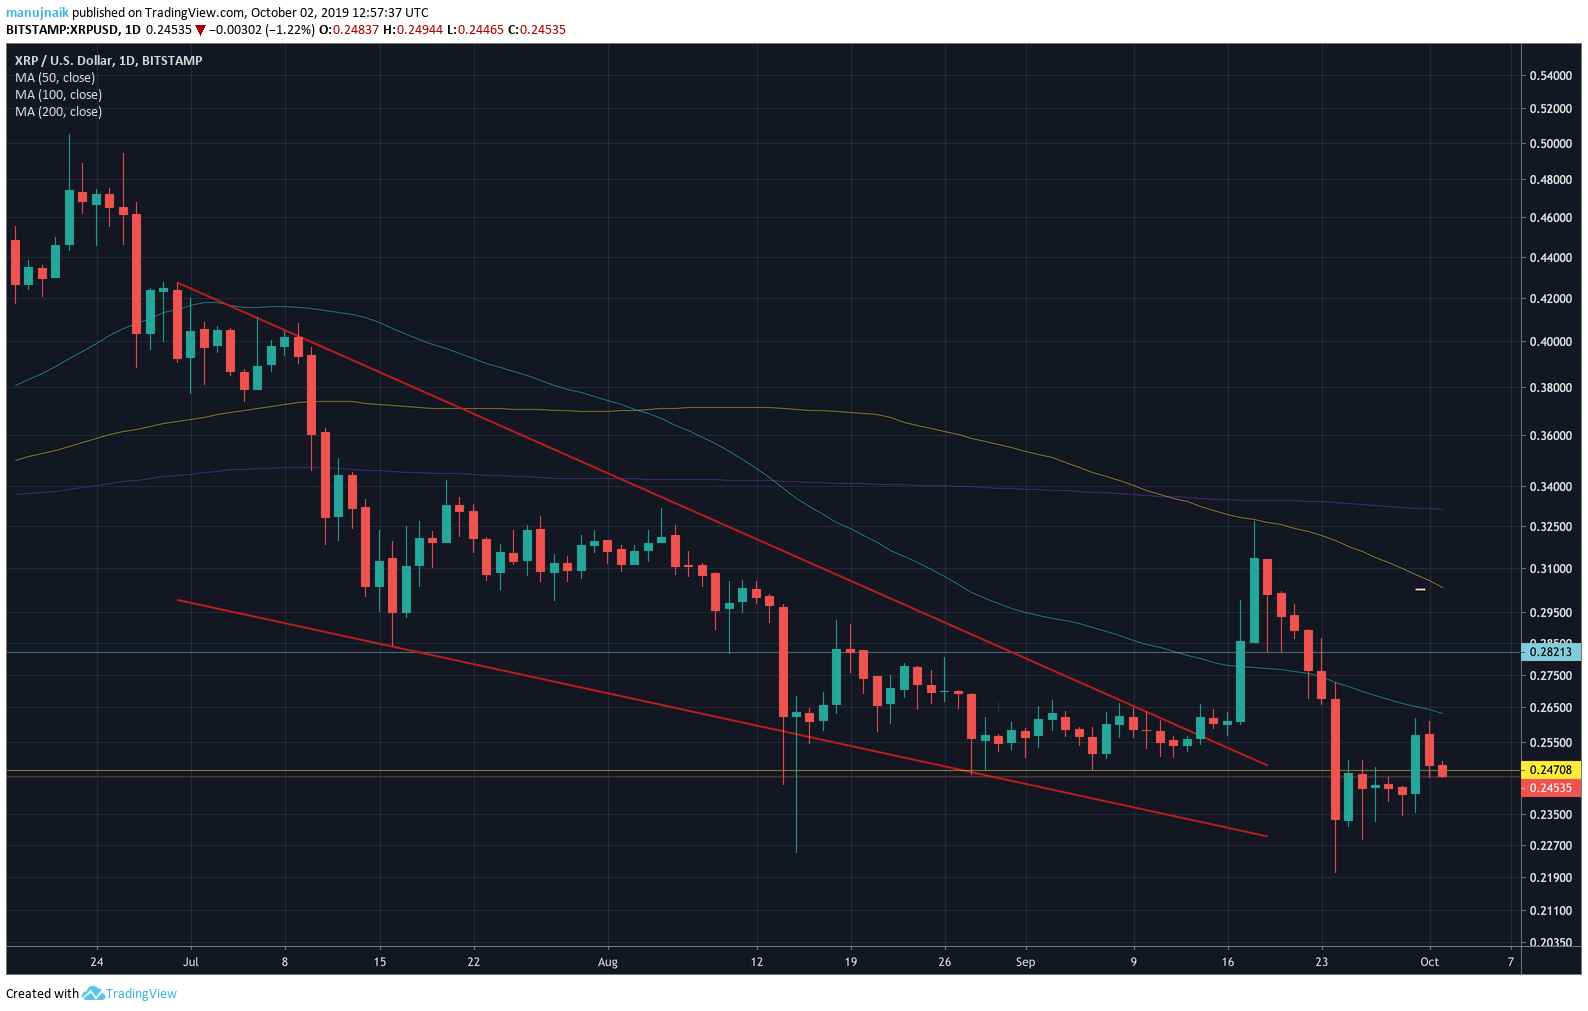
Source: TradingView
A glance at the daily price chart for XRP quickly shows its consistent decline in value over the last few months. XRP had entered into a falling wedge towards the end of June, breaking out from $0.25403 to $0.32683 in mid-September, where it tested the 100-day moving average line.
Failing to touch the 100-day line, the price fell back down below the $0.28213 support and the 50-day moving average line. It is currently testing key support $0.24708, after a short breach during the recent price dump on the 24th of August. XRP’s price had last tested this support in August 2018.
XRP could bounce back from the support line, and will have to test the 50 and 100-day moving average lines before trying to breach the $0.28213 resistance. The other scenario is that the price will drop below the support, falling down to the next support at $0.19176.
The moving averages indicate bearish movement for XRP, making the second scenario more likely. However, a drop to $0.19 was last seen only in late-2017. Only time will tell what’s to happen. What’s certain however, is that XRP could be in for a devastating future.


Leave A Comment