
Litecoin
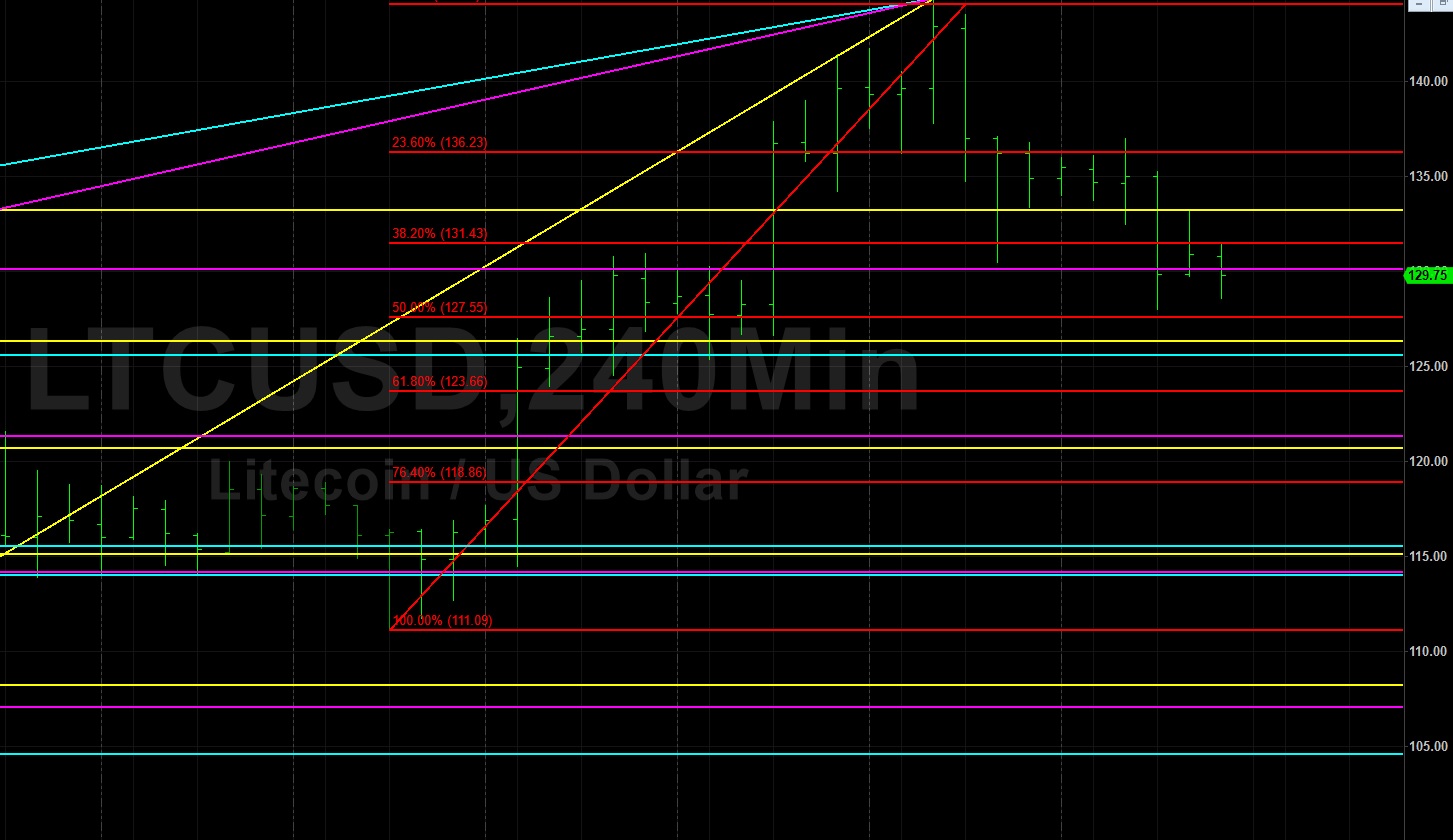
Litecoin (LTC/USD) recently traded at its strongest level since May 2018, printing as high as the 144.34 area this past week before yielding some recent gains. An extremely important level is the 137.04 area, representing the 50% retracement of the move from 251.90 to 22.17. Stops were elected above this area during the week and the pair derived some short-term constructive demand before marching lower. The 137.04 area quickly became technical Resistance during the move lower, an indication of its significance.
Another key area that was tested this week was the 121.16 area, representing the 61.8% retracement of the move from 182.35 to 22.17. Significant Stops were elected above this area during the move higher and traders are waiting to see if the area holds during pullbacks lower. The 109.93 area is also an important level above which Stops were reached, representing the 38.2% retracement of the aforementioned 251.90 – 22.17 range. Some chartists are eyeing the 112 area as a downside target while others are eyeing the 97 area as a downside target.
Price activity is nearest the 50-bar MA (4-hourly) at 122.31 and the 50-bar MA (Hourly) at 135.60.
Technical Support is expected around 121.16/ 112.72/ 102.26 with Stops expected below.
Technical Resistance is expected around 137.04/ 144.55/ 152.60 with Stops expected above.
On 4-Hourly chart, SlowK is Bearishly below SlowD while MACD is Bearishly below MACDAverage.
On 60-minute chart, SlowK is Bearishly below SlowD while MACD is Bearishly below MACDAverage.
Bitcoin Cash
Bitcoin Cash (BCH/USD) continues to trade quite technically following this week’s test of the 422.93 area, its strongest print in June and also one that represents the 50% retracement of the move from 483.33 to 362.53. Some minor Stops were elected above this area during the week but the pair was unable to sustain its move higher. Right around the same area, the 422.59 area was a key level that represents the 61.8% retracement of the move from 638.55 to 73.22.
The 100-bar MA (4-hourly) and the 200-bar MA (4-hourly) continue to converge. Below current market activity, traders are closely monitoring the 391.04 area, representing the 23.6% retracement of the move from 483.33 to 362.53. Technicians are eyeing the 388 and 362 areas as downside price objectives and possible areas of technical exhaustion.
Price activity is nearest the 100-bar MA (4-hourly) at 411.27 and the 50-bar MA (Hourly) at 400.62.
Technical Support is expected around 393.75/ 384.54/ 366.11 with Stops expected below.
Technical Resistance is expected around 422.59/ 435.23/ 454.82 with Stops expected above.
On 4-Hourly chart, SlowK is Bearishly below SlowD while MACD is Bullishly above MACDAverage.
On 60-minute chart, SlowK is Bearishly below SlowD while MACD is Bearishly below MACDAverage.


Leave A Comment