
Bitcoin
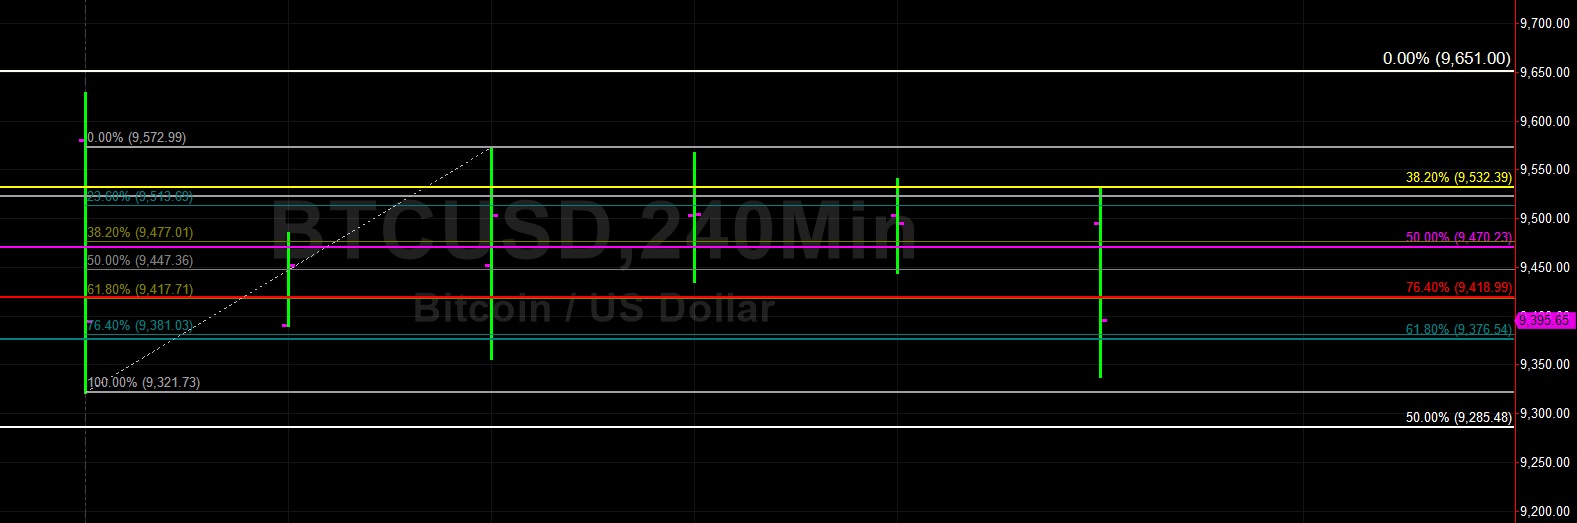
Bitcoin (BTC/USD) traded in a very narrow range early in today’s Asian session with a slightly weaker bias as the pair traded as low as the 9,420.90 area, just above the 76.4% retracement of the move from 8,045.54 to 13,865.23. During yesterday’s European session, the pair traded as high as the 9,572.99 area before sinking lower. Notably, the low early in today’s Asian session was also right around the 61.8% retracement of the recent move from 9,321.73 to 9,572.99.
An additional level that traders are watching closely on the downside is the 9,376.54 area, representing the 61.8% retracement of the 6,600 – 13,868.44 range. Also, on the upside, traders are closely watching the 9,532.39 area, a very important level that represents the 38.2% retracement of the move from 19,891.99 to 3,128.89. Given the long-term technical significance of this range, technicians are closely watching price activity around it to see if BTC/USD Bears can establish a ceiling around that area. Below current market activity, the 9,146.46 area represents another downside price objective.
Price activity is nearest the 50-bar MA (4-hourly) at 10,060.53 and the 50-bar MA (Hourly) at 9,762.31.
Technical Support is expected around 9,265.49/ 8,919.72/ 8,488.00 with Stops expected below.
Technical Resistance is expected around 9,964.93/ 10,101.47/ 10,238.00 with Stops expected above.
On 4-Hourly chart, SlowK is Bearishly below SlowD while MACD is Bearishly below MACDAverage.
On 60-minute chart, SlowK is Bearishly below SlowD while MACD is Bullishly above MACDAverage.
Ethereum
Ethereum (ETH/USD) was slightly weaker early in today’s Asian session as the pair faded to the 166.58 area after running out upward momentum around the 172.00 figure during yesterday’s North American session. Short-term technical ranges are playing a major role in ETH/USD’s current movements as the intraday high during today’s Asian session is right around the 61.8% retracement of the 173.80 – 163.57 range. The intraday high is also around the 23.6% retracement of the 163.57 – 172.00 range.
The pair’s downside bias continues to intensify the further it moves below these technical levels. Bearishness continues to deepen and it appears very likely the pair will at least test the 165.25 area again in the near-term, an important level that represents the 38.2% retracement of the move from 302.20 to 80.60. A break of that level will open up additional downside price objectives including the 152.08 area and the 142.22 area.
Price activity is nearest the 50-bar MA (4-hourly) at 185.39 and the 50-bar MA (Hourly) at 175.47.
Technical Support is expected around 165.25/ 152.08/ 142.22 with Stops expected below.
Technical Resistance is expected around 178.77/ 181.84/ 187.46 with Stops expected above.
On 4-Hourly chart, SlowK is Bearishly below SlowD while MACD is Bearishly below MACDAverage.
On 60-minute chart, SlowK is Bearishly below SlowD while MACD is Bullishly above MACDAverage.


Leave A Comment