
Bitcoin
Bitcoin (BTC/USD) extended recent gains early in today’s Asian session as the pair moved higher to the 11,474.99 area before giving back some gains and trading lower around the 11,030.00 area. During yesterday’s European session, BTC/USD moved to its strongest level since 30 June by trading around the 11,576.20 area, just below the 11,598.44 area that represents the 76.4% retracement of the move from 12,200.00 to 9651.00. The pair also failed to gain traction above the 200-bar MA (hourly) after briefly trading above that area several times during yesterday’s European and North American sessions.
Above current market activity, if technical Resistance around the 11,598 area can be absorbed, focus will technically shift to the 11,663.14 level, representing the 50.0% retracement of the move from 13,868.44 to 9651.00. Above that level, the 12,257.38 area represents the 61.8% retracement of 13,868.44 – 9651.00 range. Chartists are looking to see if BTC/USD can remain supported around the 100-bar MA (4-hourly), currently indicating around the 10,747.79 level.
Price activity is nearest the 50-bar MA (4-hourly) at 10,506.78 and the 100-bar MA (Hourly) at 11,019.03.
Technical Support is expected around 10,137.67/ 9953.00/ 9765.93 with Stops expected below.
Technical Resistance is expected around 11,759.72/ 12,084.22/ 12,257.38 with Stops expected above.
On 4-Hourly chart, SlowK is Bullishly above SlowD while MACD is Bullishly above MACDAverage.
On 60-minute chart, SlowK is Bearishly below SlowD while MACD is Bearishly below MACDAverage.
Ethereum
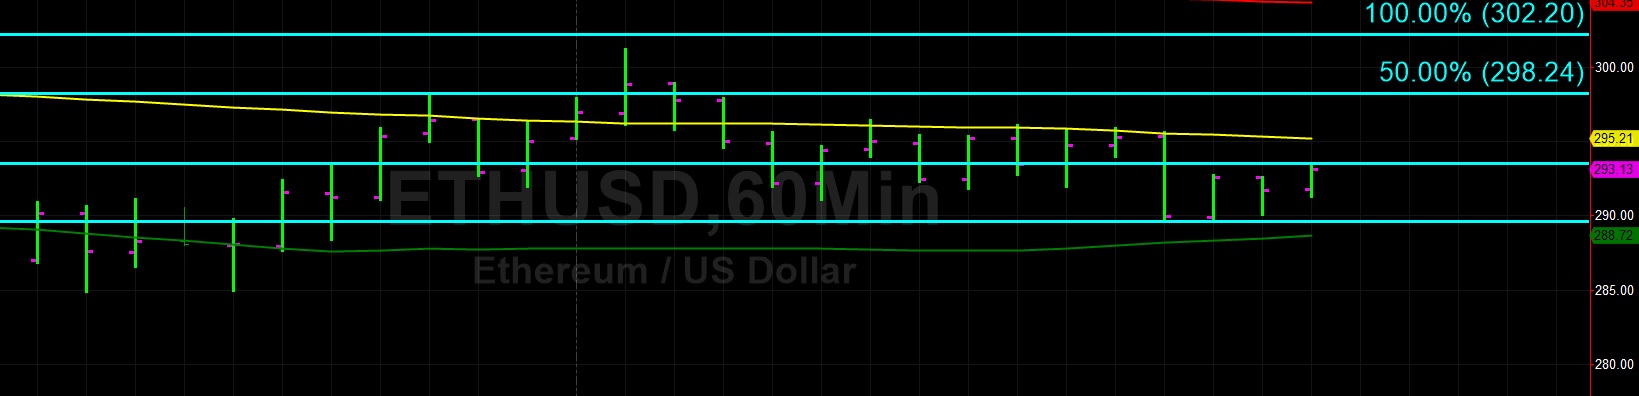
Ethereum (ETH/USD) gained a little bit of ground early in today’s Asian session as the pair traded as high as the 296.09 area before moving lower and testing Bids around the 289.61 level, right around the 38.2% retracement of the move from 627.83 to 80.60. During yesterday’s European session, the pair traded as high as the 301.23 area, below a relative historical high around the 302.20 level. ETH/USD was unable to sustain its move above the 100-bar MA (4-hourly) though, and moved back below during yesterday’s North American session.
Above current market activity, the 304.11 area represents the 61.8% retracement of the move from 324.50 to 271.12, and the 50-bar MA (4-hourly) is currently indicating around the 304.36 area. Technicians anticipate a series of Offers between the 314.00 – 317 levels related to technical Resistance around those areas. Below current market activity, the 285.34 area is a technically-relevant area that represents the 38.2% retracement of the move from 157.28 to 364.49. Additionally, technicians anticipate a series of Bids between 280 and 283 related to technical Support around those levels.
Price activity is nearest the 100-bar MA (4-hourly) at 296.11 and the 100-bar MA (Hourly) at 295.20.
Technical Support is expected around 272.56/ 249.90/ 226.56 with Stops expected below.
Technical Resistance is expected around 314.00/ 322.16/ 329.73 with Stops expected above.
On 4-Hourly chart, SlowK is Bearishly below SlowD while MACD is Bullishly above MACDAverage.
On 60-minute chart, SlowK is Bullishly above SlowD while MACD is Bearishly below MACDAverage.


Leave A Comment