
Bitcoin (BTC) might be in a multi-year bear market and we have good reason to believe that this might be a case. There is a lot of noise and confusion on the shorter time frames but the big picture always shows us everything in a crystal clear manner without any ambiguities. If we look at the monthly chart for BTC/USD without using any fancy technical analysis tools but just drawing a simple trend line, we see two things. The first thing we see is that when BTC/USD broke and closed below the 21 Month EMA for the first time since 2012, a lot of investors realized that no matter how wonderful of an invention Bitcoin (BTC) might be, it experiences market cycles just like other financial assets.
So, when the price started to rally again, a lot of people kept on selling in anticipation of the top and we saw that the parabolic run up was less steep than the one in the previous cycle. Also, the price rallied at a much slower pace and did not register as much growth as it did between 2012 and 2014. Now, this is the first thing that we see and this is why we believe that the ongoing market cycle has to be longer not shorter than the previous one which is why there is no reason to believe the bear market has ended just yet. However, there is something more serious that a lot of people are not taking seriously and that is the trend line we see on the monthly chart. As we can see, this trend line has never been broken since 2012. Now, the fact that this was broken in November, 2018 means that we should have more reason to be bearish than bullish on Bitcoin (BTC) long term.
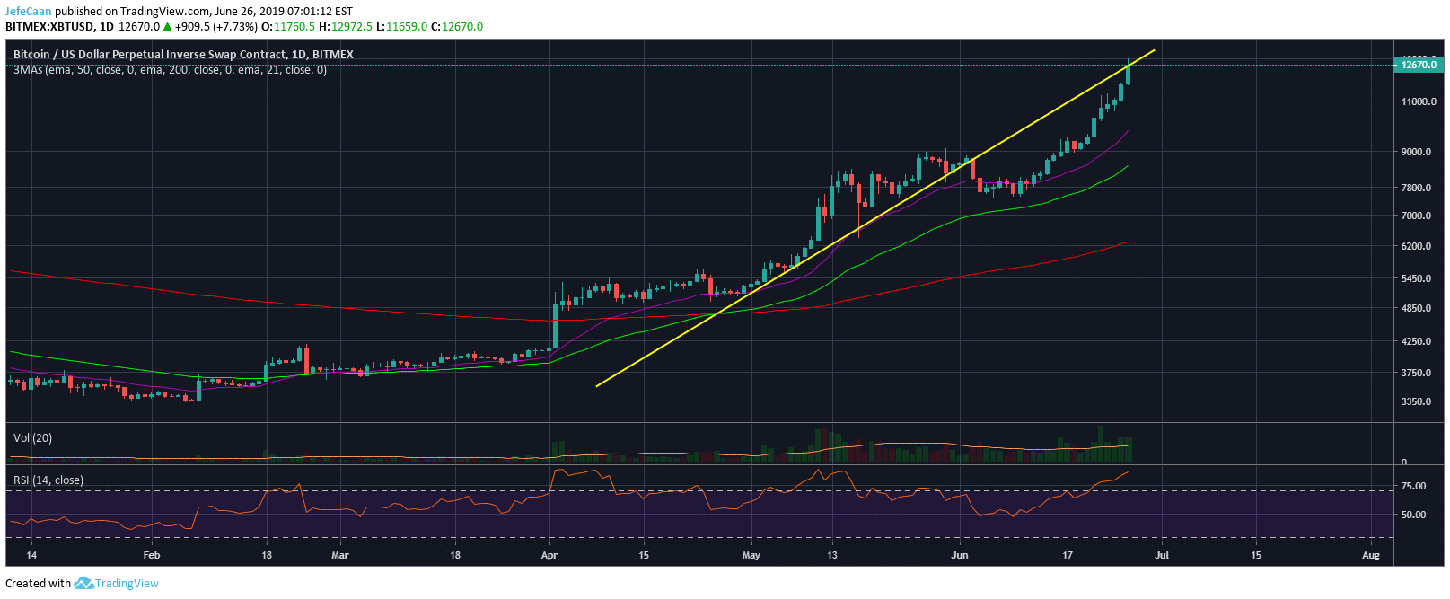
Now, here is where it gets very interesting. If we look at this daily chart for BTC/USD and compare it with the monthly chart, we see very strong similarities. The price tested a trend line on the monthly chart as support multiple times until it broke below it. Similarly, the price tested this trend line many times between May and June many times until it was broken around the beginning of this month. This time, the price has now visited this trend line as resistance. If you look at the monthly chart, the exact same thing has happened there.

The long term outlook of Bitcoin (BTC) hinges on what it does from here on out. If it begins to fall and retraces down to $10,000 towards the end of the month, we will have confirmation that it has faced a rejection on the monthly time frame and the next few months are going to be deadly for Bitcoin (BTC). In fact, if we look at the monthly chart BTC/USD has broken a critical trend line support and if the global political and economic situation worsens in the months ahead, we might see BTC/USD fall to levels beyond imagination of the crypto community.


Leave A Comment